Graylog in Action
- What Is Graylog?
- Installing Graylog
- Graylog Architecture
- Graylog Core Features
- Getting Started
- The Graylog Extended Log Format (GELF)
- The Basis: Graylog + Data Node + MongoDB
- Community and Resources
- Planning Your Deployment
- Planning Your Log Collection
- Deployment Options
- Initial Configuration Settings
- Index Model
- Rest API
- GELF
- Graylog Sidecar
- Searching Your Log Data
- Writing Search Queries
- Frequently Asked Questions
- What is MongoDB used for?
- Does Graylog encrypt log data?
- Where are the log files Graylog produces?
- How do I find out if a specific log source is supported?
- Can Graylog automatically clean old data?
- Can I filter inbound messages before they are processed by the Graylog server?
- What is the best way to integrate my applications to Graylog?
- I don’t want to use Elasticsearch/OpenSearch as my backend storage system - can I use another database, like MySQL, Oracle, etc?
- I’m sending in messages, and I can see they are being accepted by Graylog, but I can’t see them in the search. What is going wrong?
- Elasticsearch REST APIs
- Graylog 问题定位
- Refer
What Is Graylog?
Graylog - A centralized Log Management System (LMS)
Graylog, Inc is a log management and security analytics software company based in Houston, Texas. Their main product is a log management software which is also called Graylog (styled as graylog).
These days we deal with an abundance of data. This data comes from various sources like devices, applications, and operating systems. A centralized Log Management System (LMS) like Graylog provides a means to aggregate, organize, and make sense of all this data.
Log files are essentially text files. They contain an abundance of information–application name, IP address, time stamp, and source destination. All applications and even operating systems themselves create these logs containing massive amounts of data, which needs to be parsed if we want to make any sense of it.
An LMS must also be efficient in collecting and parsing petabytes of data. Once it has been parsed, log data can provide extremely useful information for forensic investigations, threat hunting, and business analytics in general. Whatever the use case, Graylog can help businesses look further into their data and save time and human resources.
Installing Graylog
Warning:
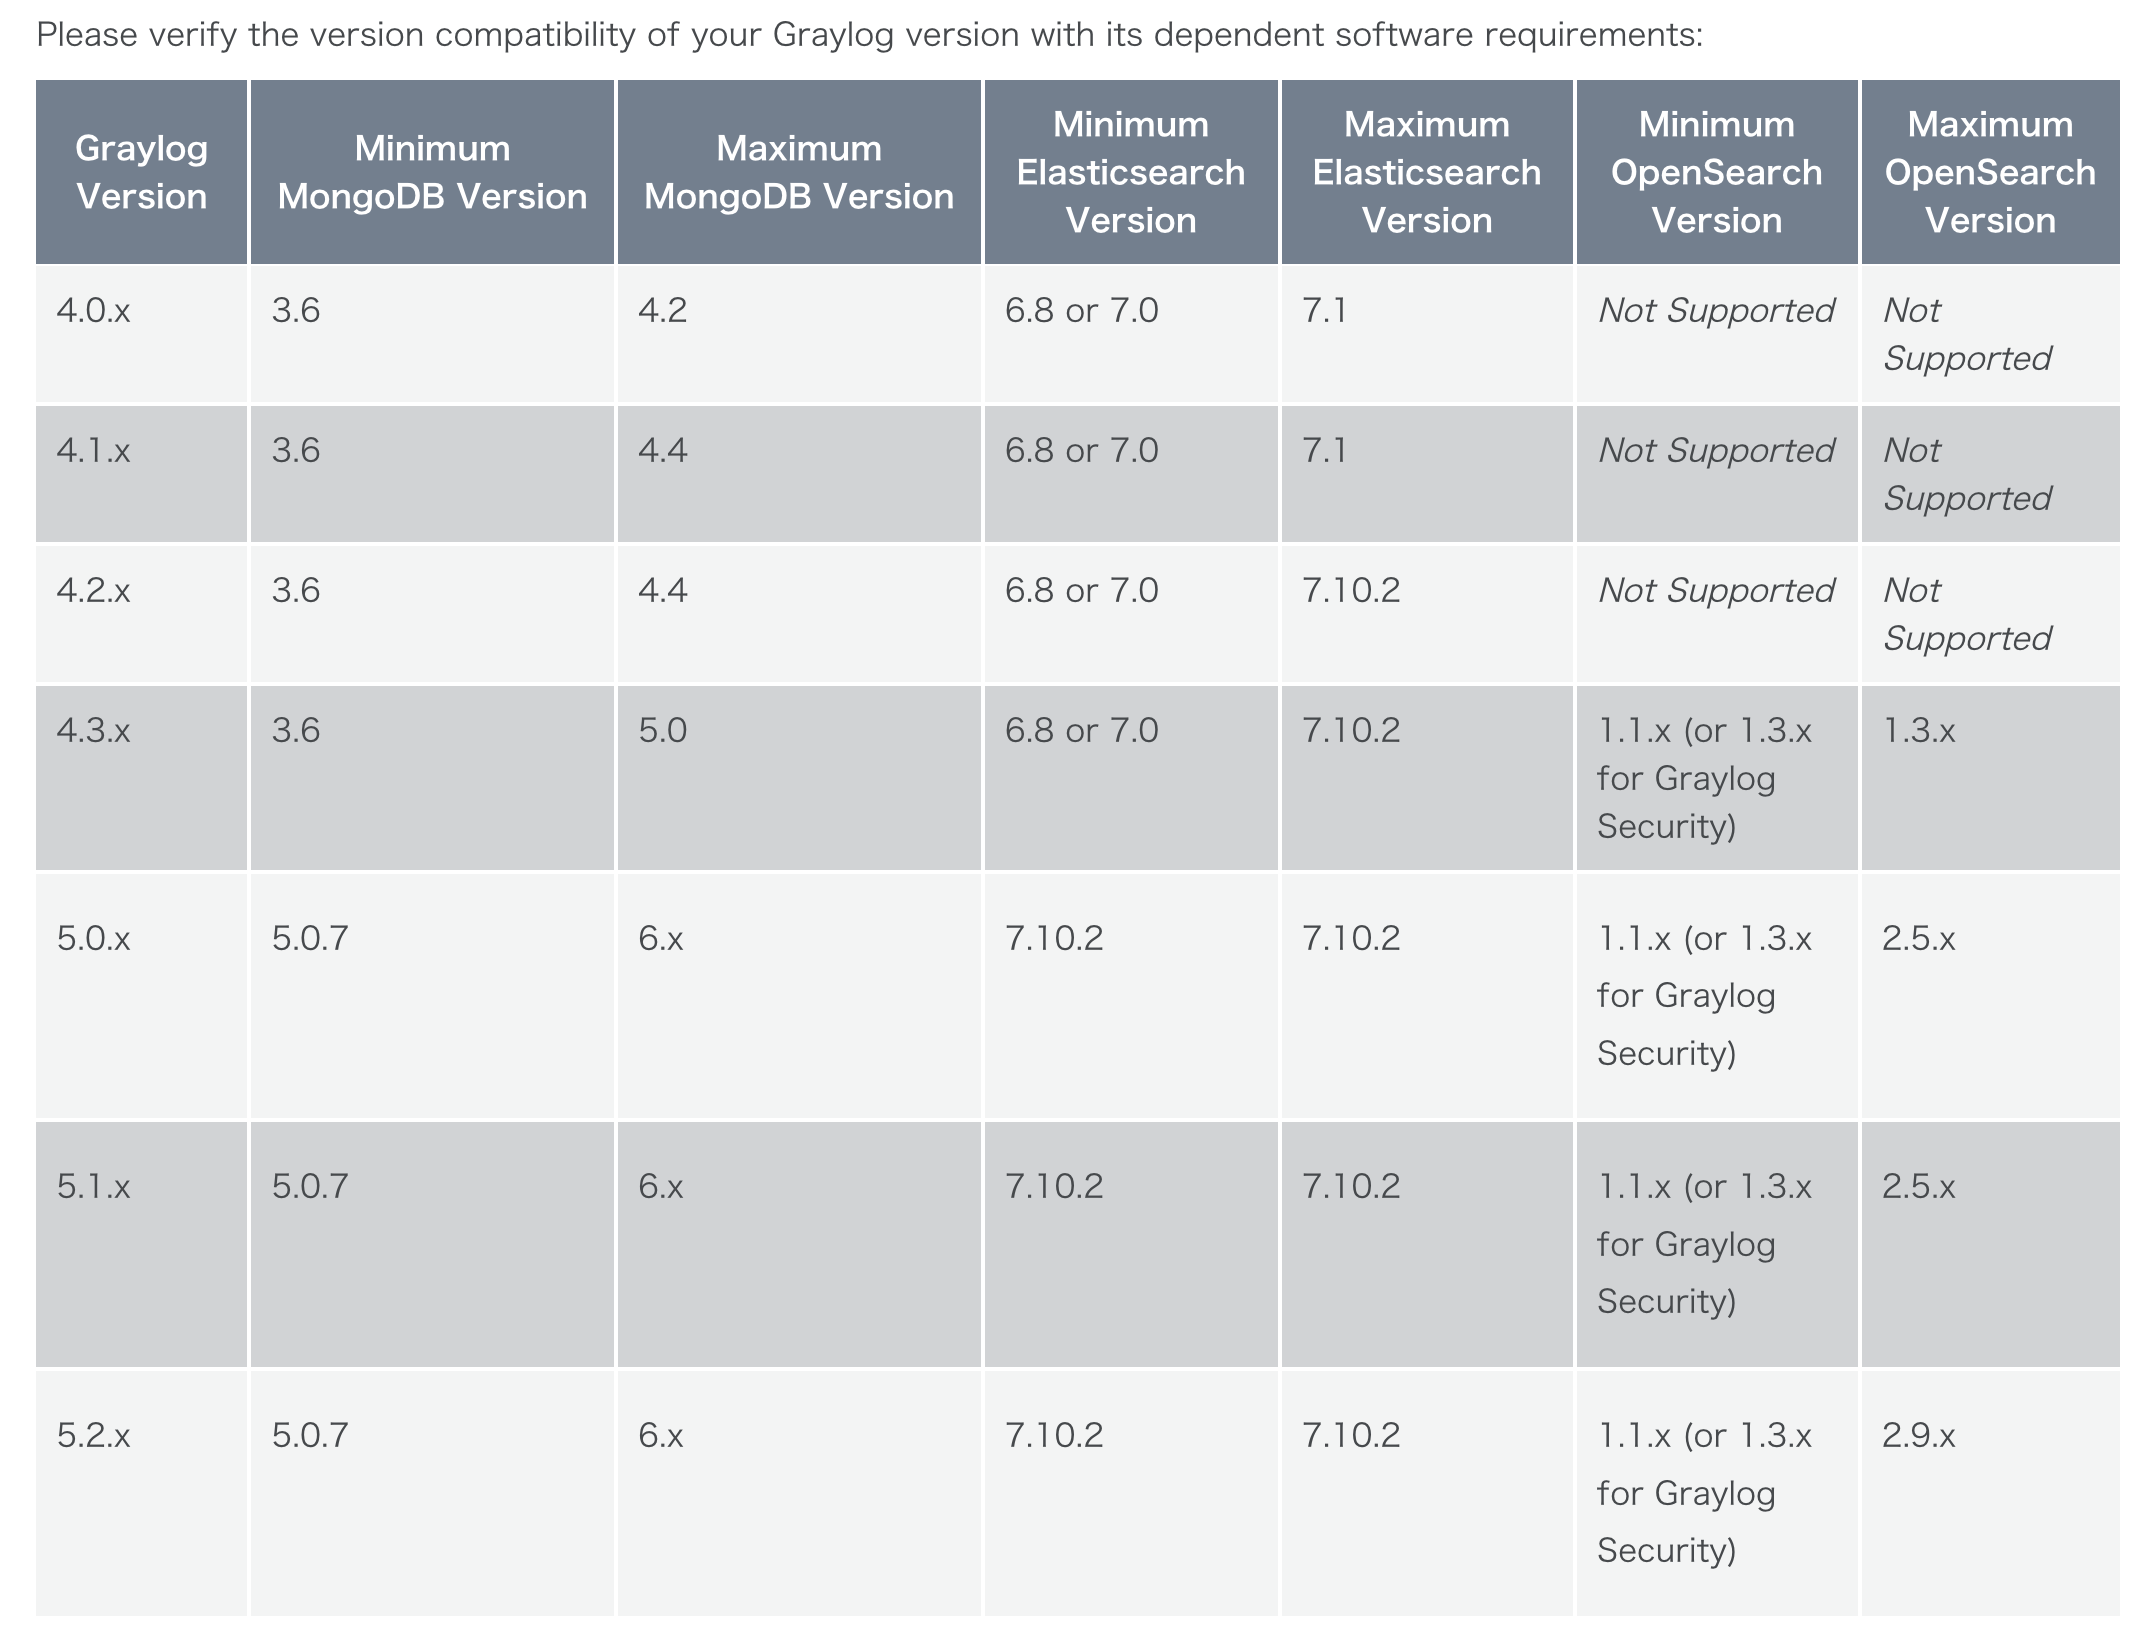
We caution you not to install or upgrade Elasticsearch to 7.11 or later! It is not supported. Doing so will break your instance!
Graylog 5.2 is the last version to include support for Elasticsearch (7.10.2 only)! We recommend you use OpenSearch 2.x as your data node to support Graylog 5.2.
Compatibility Matrix
- https://github.com/KongZ/charts/tree/main/charts/graylog
- https://go2docs.graylog.org/5-2/downloading_and_installing_graylog/installing_graylog_operations.html
Graylog Architecture
Graylog 的架构专为日志管理和分析而设计,使其成为一种高效的日志管理系统(LMS)。该架构旨在处理时间轴上的文本数据和指标数据,确保日志数据的高效准确管理。Graylog 的架构由几个组件组成,每个组件负责日志管理的不同方面,包括处理、索引和数据访问。
- 数据摄取和转发器:Graylog 使用数据摄取工具或转发器从各种来源收集日志数据。这些转发器可以通过 REST API 进行管理和配置,使系统管理员能够轻松地从远程主机选择日志文件以供摄取到系统中。
- 数据处理器:数据处理器负责解析和处理日志数据。它们对数据进行规范化和丰富,使数据更有价值且易于分析。
- 索引器:索引器负责存储和索引日志数据。它们确保数据有组织且易于搜索。
- 数据访问:Graylog 为用户提供 Web 界面,以访问和分析日志数据。用户可以根据时间范围执行搜索,查看所有转发器、数据处理器和索引器的运行状况和配置,并监控整个系统的运行状况。
- 可伸缩性:Graylog 的架构允许水平伸缩,使其能够适应不断变化的用例和不断增长的数据量。系统的不同部分具有不同的硬件需求,可以根据需要独立进行伸缩。
- 集中式管理:Graylog 的架构确保所有服务紧密集成,允许整个系统的高效管理和配置。管理员可以在一个中心位置监控所有组件的运行状况和配置,确保不会错过任何重要数据。
总之,Graylog 的架构专为日志管理而设计,为处理日志数据提供了高效且可伸缩的解决方案。其组件协同工作以处理、索引和让日志数据可供分析,确保用户可以有效地管理和监控他们的日志数据。
Hint: Please note that Graylog cannot modify saved log data. It provides the core centralized log management functionality you need to aggregate, organize, and interpret data so that you can derive meaningful insights while maintaining data integrity.
Graylog Core Features
Graylog 作为一种灵活的工具,具有许多增强其实用性的功能。
- 流(Streams)作为传入消息的一种标签形式。流实时将消息路由到各个类别,团队规则指导 Graylog 将消息路由到适当的流。
- 流用于将数据路由到索引以进行存储。它们还用于控制对数据的访问,并将消息路由到解析、丰富和其他修改。然后,流确定要存档哪些消息。
- Graylog 搜索页面是用于直接搜索日志的界面。Graylog 使用简化的语法,非常类似于 Lucene。相对或绝对时间范围可以从下拉菜单中配置。可以保存搜索或将其可视化为可直接从搜索屏幕中添加到仪表板的仪表板小部件。
- 用户可以配置自己的视图,并可以选择查看事件消息的摘要或完整数据。
- Graylog 仪表板是日志事件中包含的信息的可视化或汇总。每个仪表板由一个或多个小部件填充。小部件使用从字段值(如计数、平均值或总计)派生的数据可视化或汇总事件日志数据。用户可以创建指示器、图表、图形和地图来可视化数据。
- 仪表板小部件和仪表板布局是可配置的。Graylog 的基于角色的访问控制仪表板访问。用户可以通过内容包导入和导出仪表板。
- 通过使用由条件组成的事件定义创建警报。满足给定条件时,它将作为事件存储并可用于触发通知。
- 内容包加速了针对特定数据源的设置过程。内容包可以包括输入/提取器、流、仪表板、警报和管道处理器。例如,用户可以创建自定义输入、流、仪表板和警报以支持安全用例。然后,用户可以导出内容包并将其导入到新安装的 Graylog 实例上,以节省配置时间和精力。
- 用户可以通过 Graylog 市场下载其他用户创建、共享和支持的内容包。
- 索引是 OpenSearch 和 Elasticsearch 中数据存储的基本单元。索引集为存储数据的保留、分片和复制提供配置。诸如保留和轮换策略之类的值是按索引设置的,因此不同的数据可能受到不同的处理规则。
- Graylog Sidecar 是一个代理,用于管理日志发货程序的机群,如 Beats 或 NXLog。这些日志发货程序用于从 Linux 和 Windows 服务器收集操作系统日志。日志发货程序读取本地写入的平面文件日志,然后将其发送到集中式日志管理解决方案。Graylog 支持作为后端管理任何日志发货程序。
- Graylog 的处理管道使用户能够针对特定类型的事件运行一个规则或一系列规则。与流绑定,管道允许在消息流经 Graylog 时进行路由、拒绝列表、修改和丰富。
Getting Started
Send in first log messages
Graylog is pretty useless without some log data in it. Let’s start by sending in some messages.
Select a source
Your own applications
A very common use case is to write logs directly from your applications and services into Graylog. We have developed the Graylog Extended Log Format (GELF) to help you with exactly that. GELF is a structured log format supported by almost a hundred libraries out there. Want to send GELF directly from Java, Ruby, PHP, node.js, Erlang or anything else? No problem.
Local log files
Sometimes you only have a local log file that you want to send into Graylog. Luckily there are many ways to tail a logfile and reliably forward new log lines over the network:
- The Graylog Collector
The Graylog Collector is a lightweight Java application that allows you to forward data from log files to a Graylog cluster. The collector can read local log files and also Windows Events natively, it then can forward the log messages over the network using the GELF format.
- Logstash, NXLog, Fluentd
There are other forwarders that we have seen used successfully in user and customer environments. Logstash, NXLog and fluentd are all worth a look.
Starting a message input in Graylog
By now you have selected a device or software that you want to send log messages from into Graylog. The next thing to do is to start a message input that your source can send its log messages to.
Good to know
There are a few general things to know:
- Ports lower than 1024
Most Linux distributions systems will not allow a non-root user to start a message input listening on a port lower than 1024. There are workaround to allow this, but our advice is to just use a higher port number. The standard syslog port is 514, so you could just launch it on 5140.
- Inputs that could not be launched
If an input could not be launched (for example because of the <1024 problem mentioned above or because something else is already listening on the same port) you will get a notification in System -> Overview that usually also gives a hint about what went wrong. The graylog-server log file can help with debugging, too.
How to debug if messages arrived
We of course hope that everything works on the first attempt and you can immediately find messages you sent into Graylog by executing a search. This is however sometimes not the case. Here are two things that help with debugging:
- Look at the input metrics to see if any data arrived
The inputs overview page shows you metrics of established connections and how many bytes were transferred since the graylog-server process started. This can help you identify if your sources are connected to Graylog at all, or if there are connectivity problems or firewalls in between.
- Find all messages ever received by a specific input
Sometimes your devices send a wrong timestamp which will lead to many time range searches not returning the messages you expect. Hit the Show received messages button to execute a search for everything that ever came in through this input and you should see them.
Launching an input
Launching an input is easy. Navigate to System -> Inputs, select an input type from the drop down box, and hit Launch new input. A dialog will open, and ask you for some configuration parameters.
You can now point the source you decided to start with towards your newly created input. Hitting the Show received messages button on the inputs overview page should show you messages that were received right away.
Do something with your data
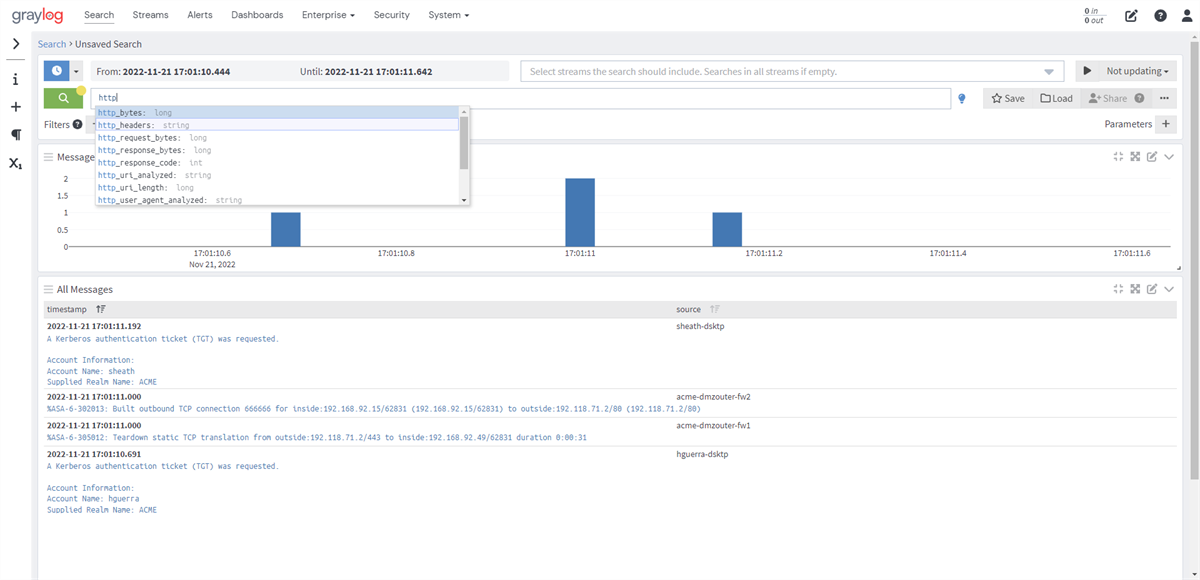
Basic searches
Hit Search in the main Graylog navigation, and you should be presented with an analysis of all data that was received in the last 5 minutes. Let’s look at the elements of that page:
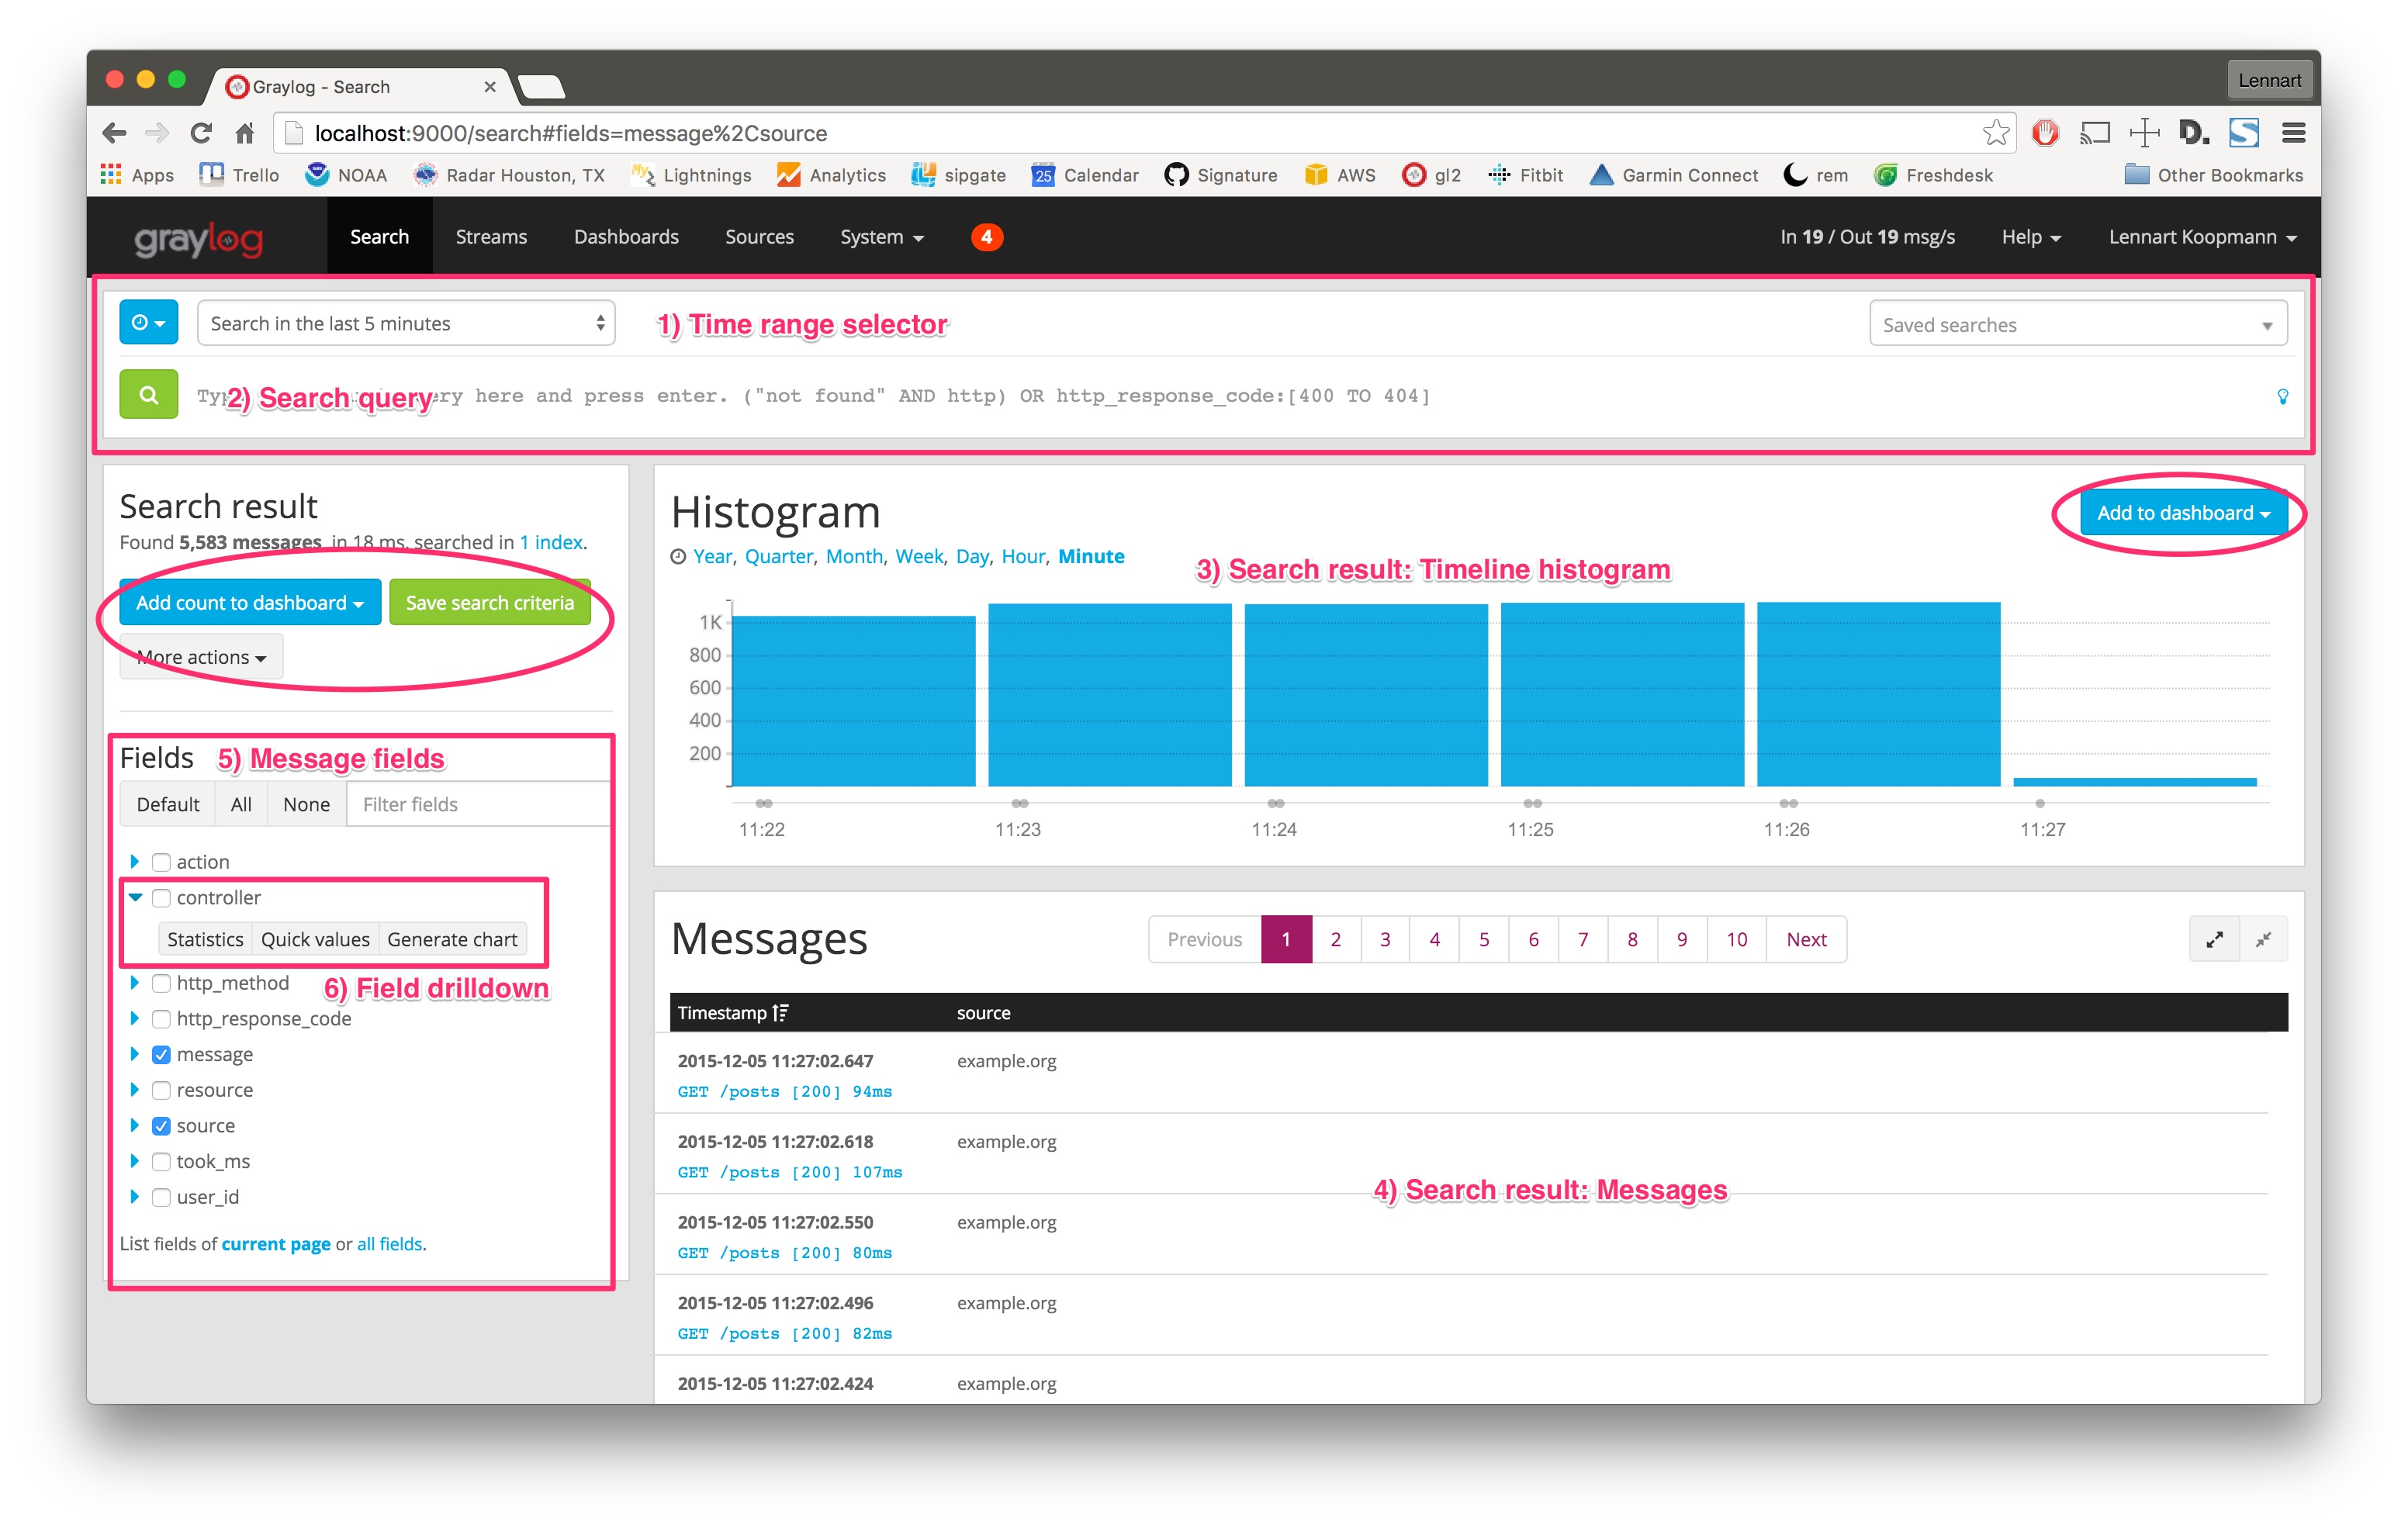
- Time range selector: Select the time range you want to search in. Hit the blue button to select a time range type. Note that for best performance you should always choose the shortest reasonable time range.
- Search query: Enter your search query here. If you want to find all messages in the selected timerange, you can just press enter without typing anything or alternatively use
*as query. - Timeline histogram: The timeline histogram chart shows you how many messages were found per minute/hour/day/week/month/quarter/year in the selected time range. It is a great way to quickly see when how many messages were received.
- Messages: The messages that your search returned. Click on a message to expand it.
- Message fields: A list of all fields that are part of the messages that your search returned. Click on a checkbox next to a field to include the field and its values in the search results table. Click on the blue arrow to expand field drilldown options.
- Field drilldown: The field drilldown analysis methods allow you to dig deeper into a fields value (computed over the selected time range).
Example
Let’s start with a search over everything that was received in the last 15 minutes, and try to find out which sources sent the most data.
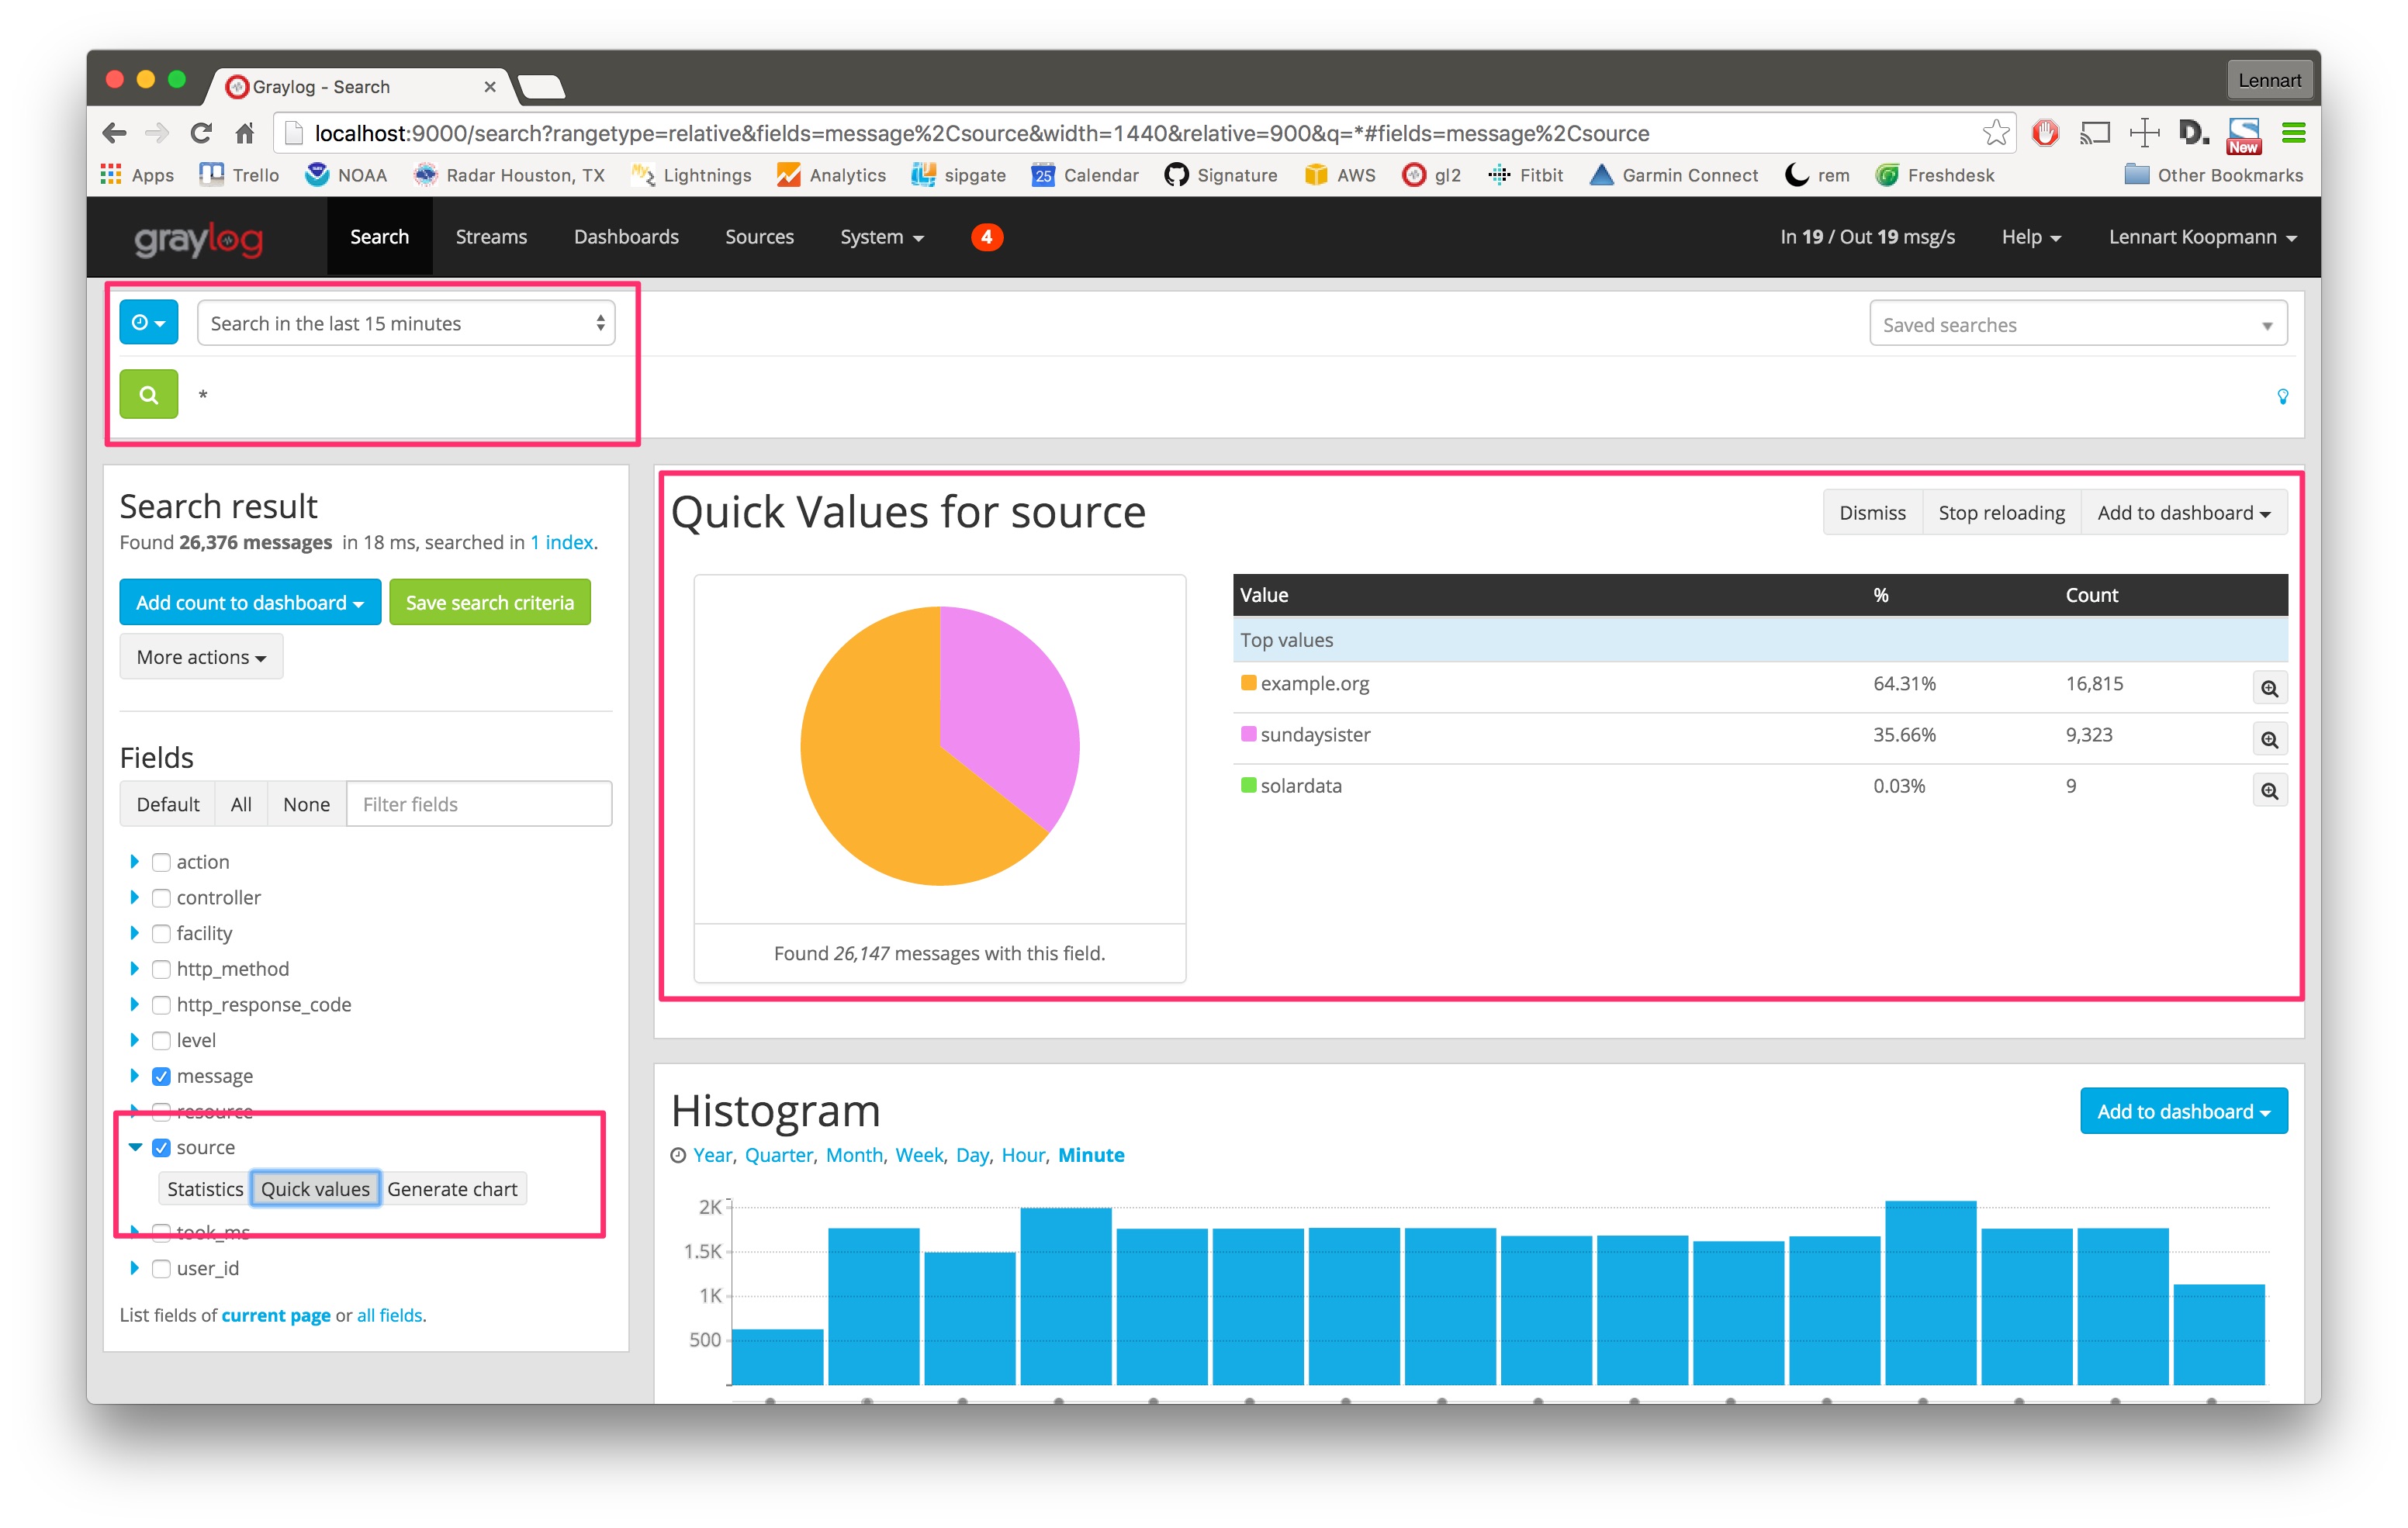
Hit the blue arrow next to the source field and then the Quick values button. This will load the quick value analysis result on top of the search results. You can see that (in the last 15 minutes) the source example.org sent 64.31% of all data and 16,815 messages in total.
The source sundaysister (a hostname of a syslog enabled device) sent 35.66% of the data. Let’s dig deeper into that source and find out what kind of data was sent.
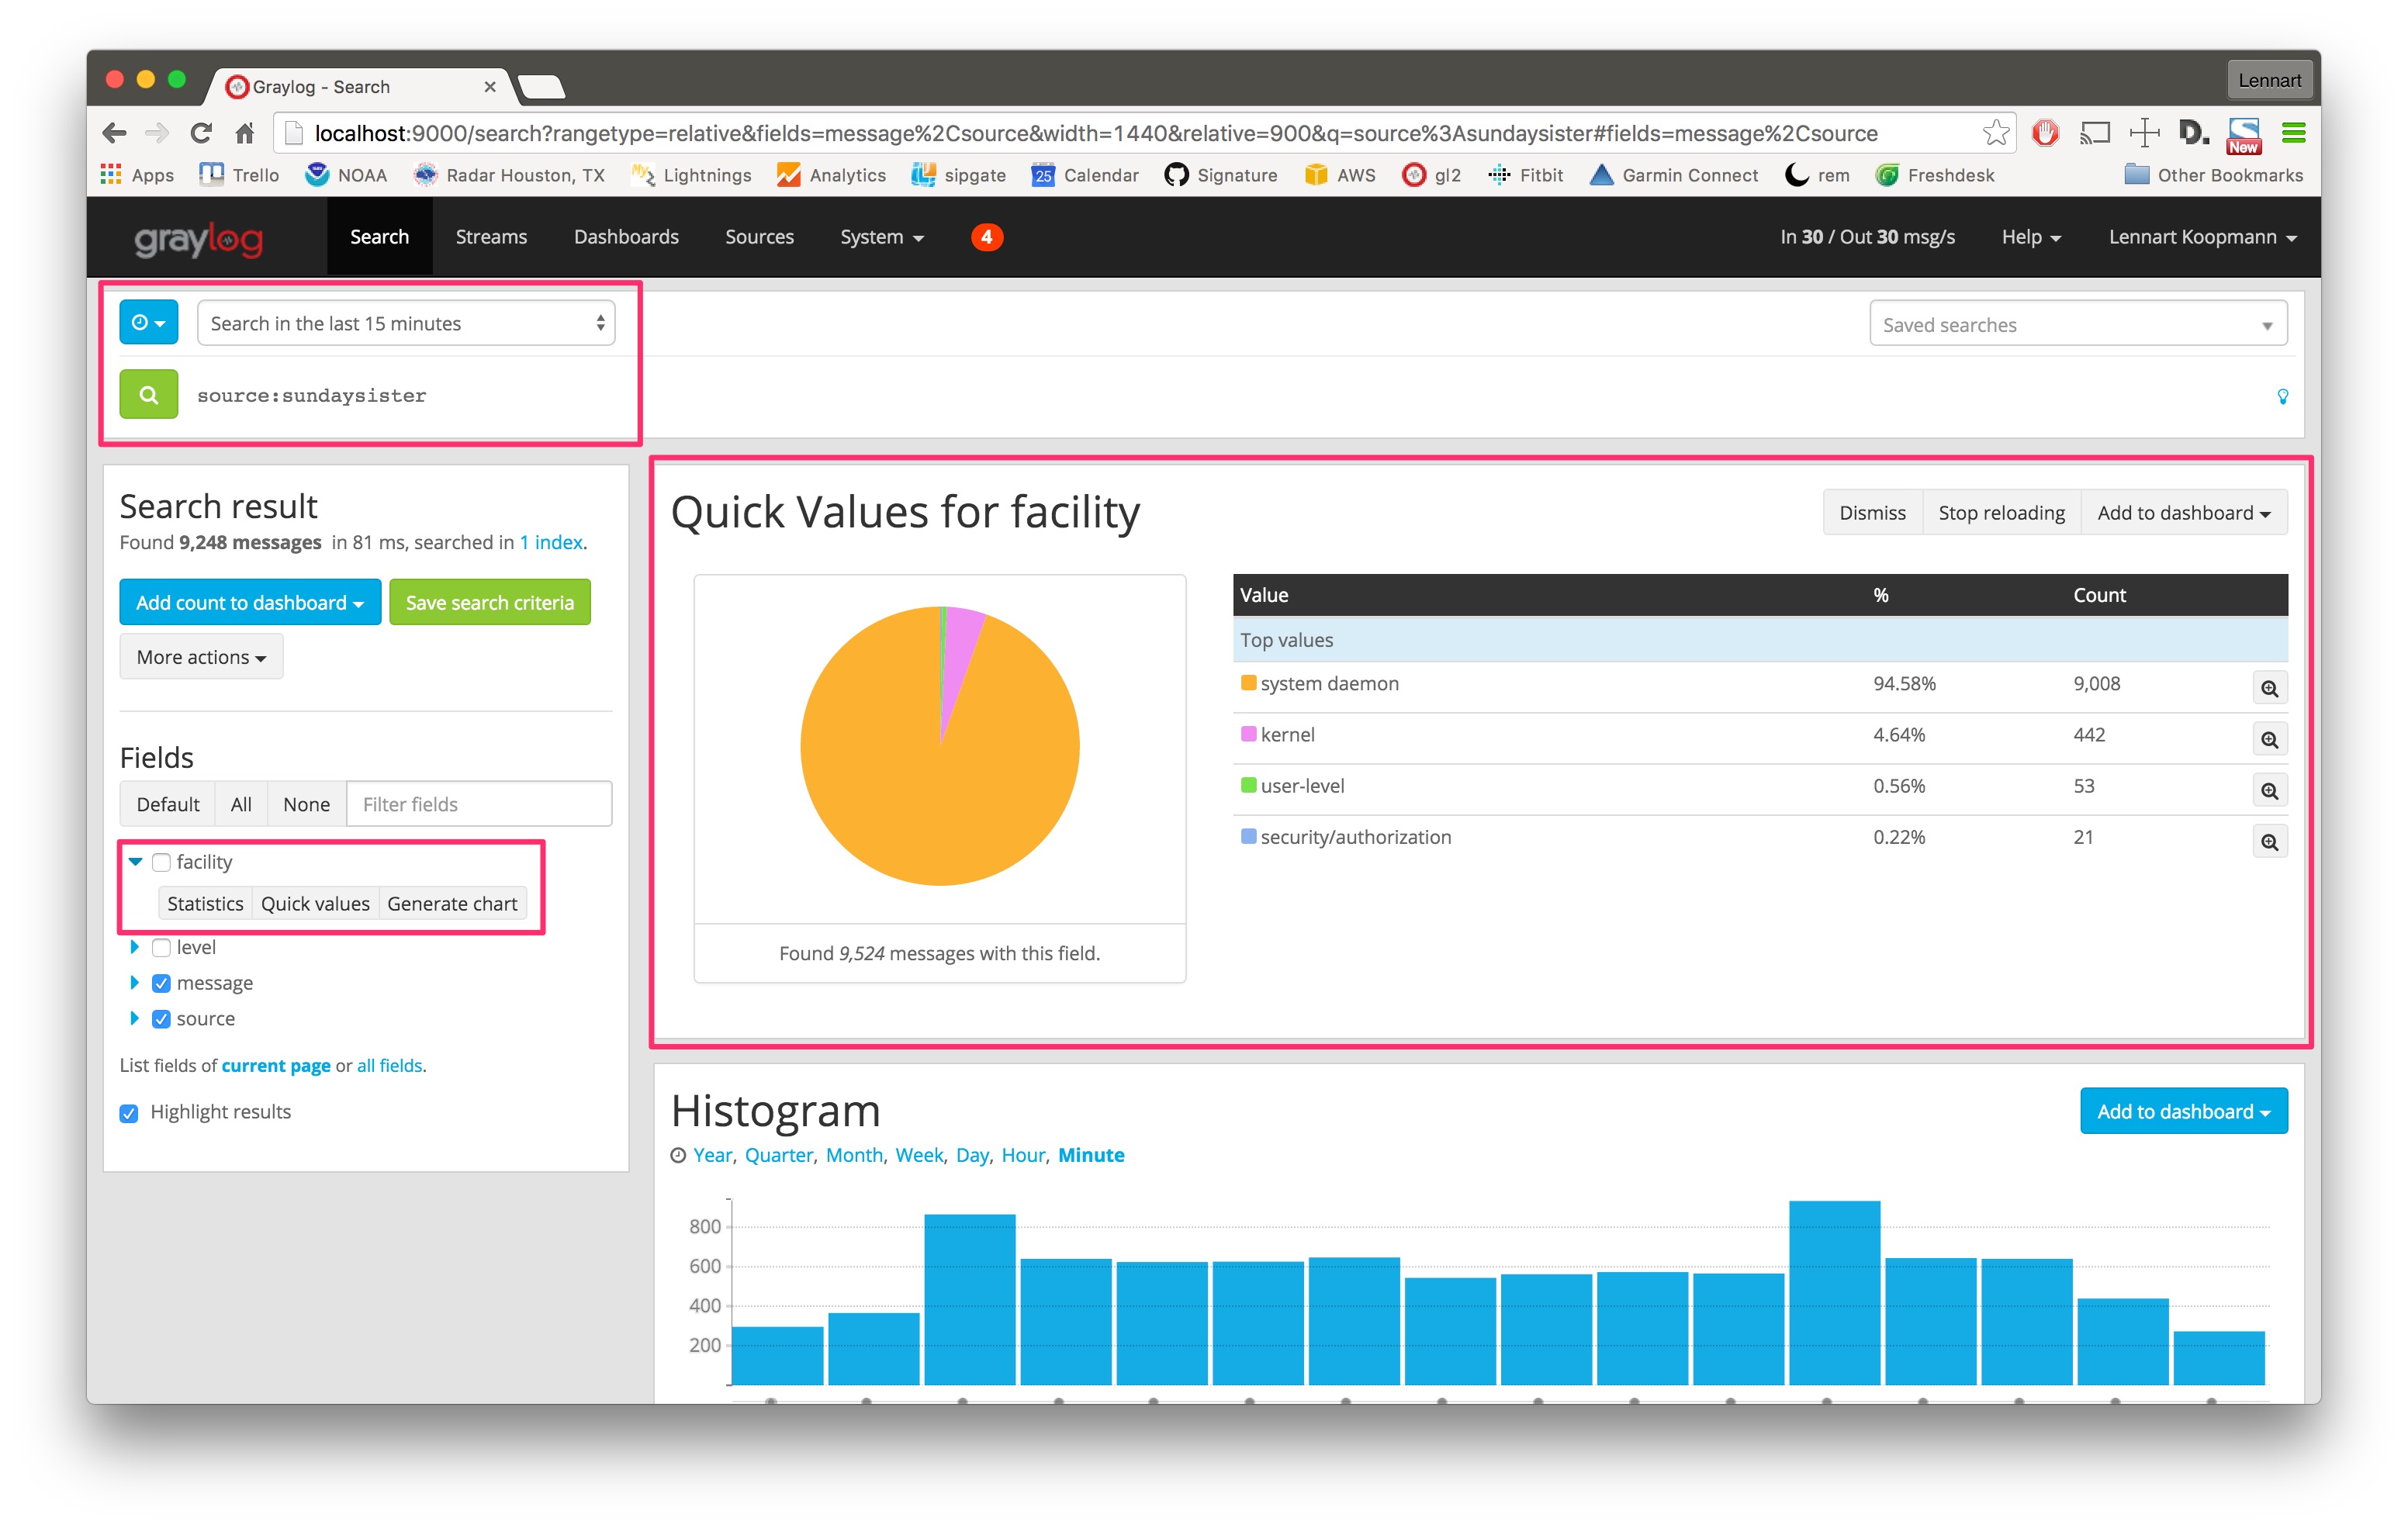
Search for all messages from that specific source (source:sundaysister) and run a quick values analysis on the facility field. You can see that 94.58% of the messages from this source in the last 15 minutes came from the system daemon subsystems (facility).
Let’s look at a second example and try to figure out the response time of a specific part of a web application. (Those structure messages can be achieved using GELF or extractors.)
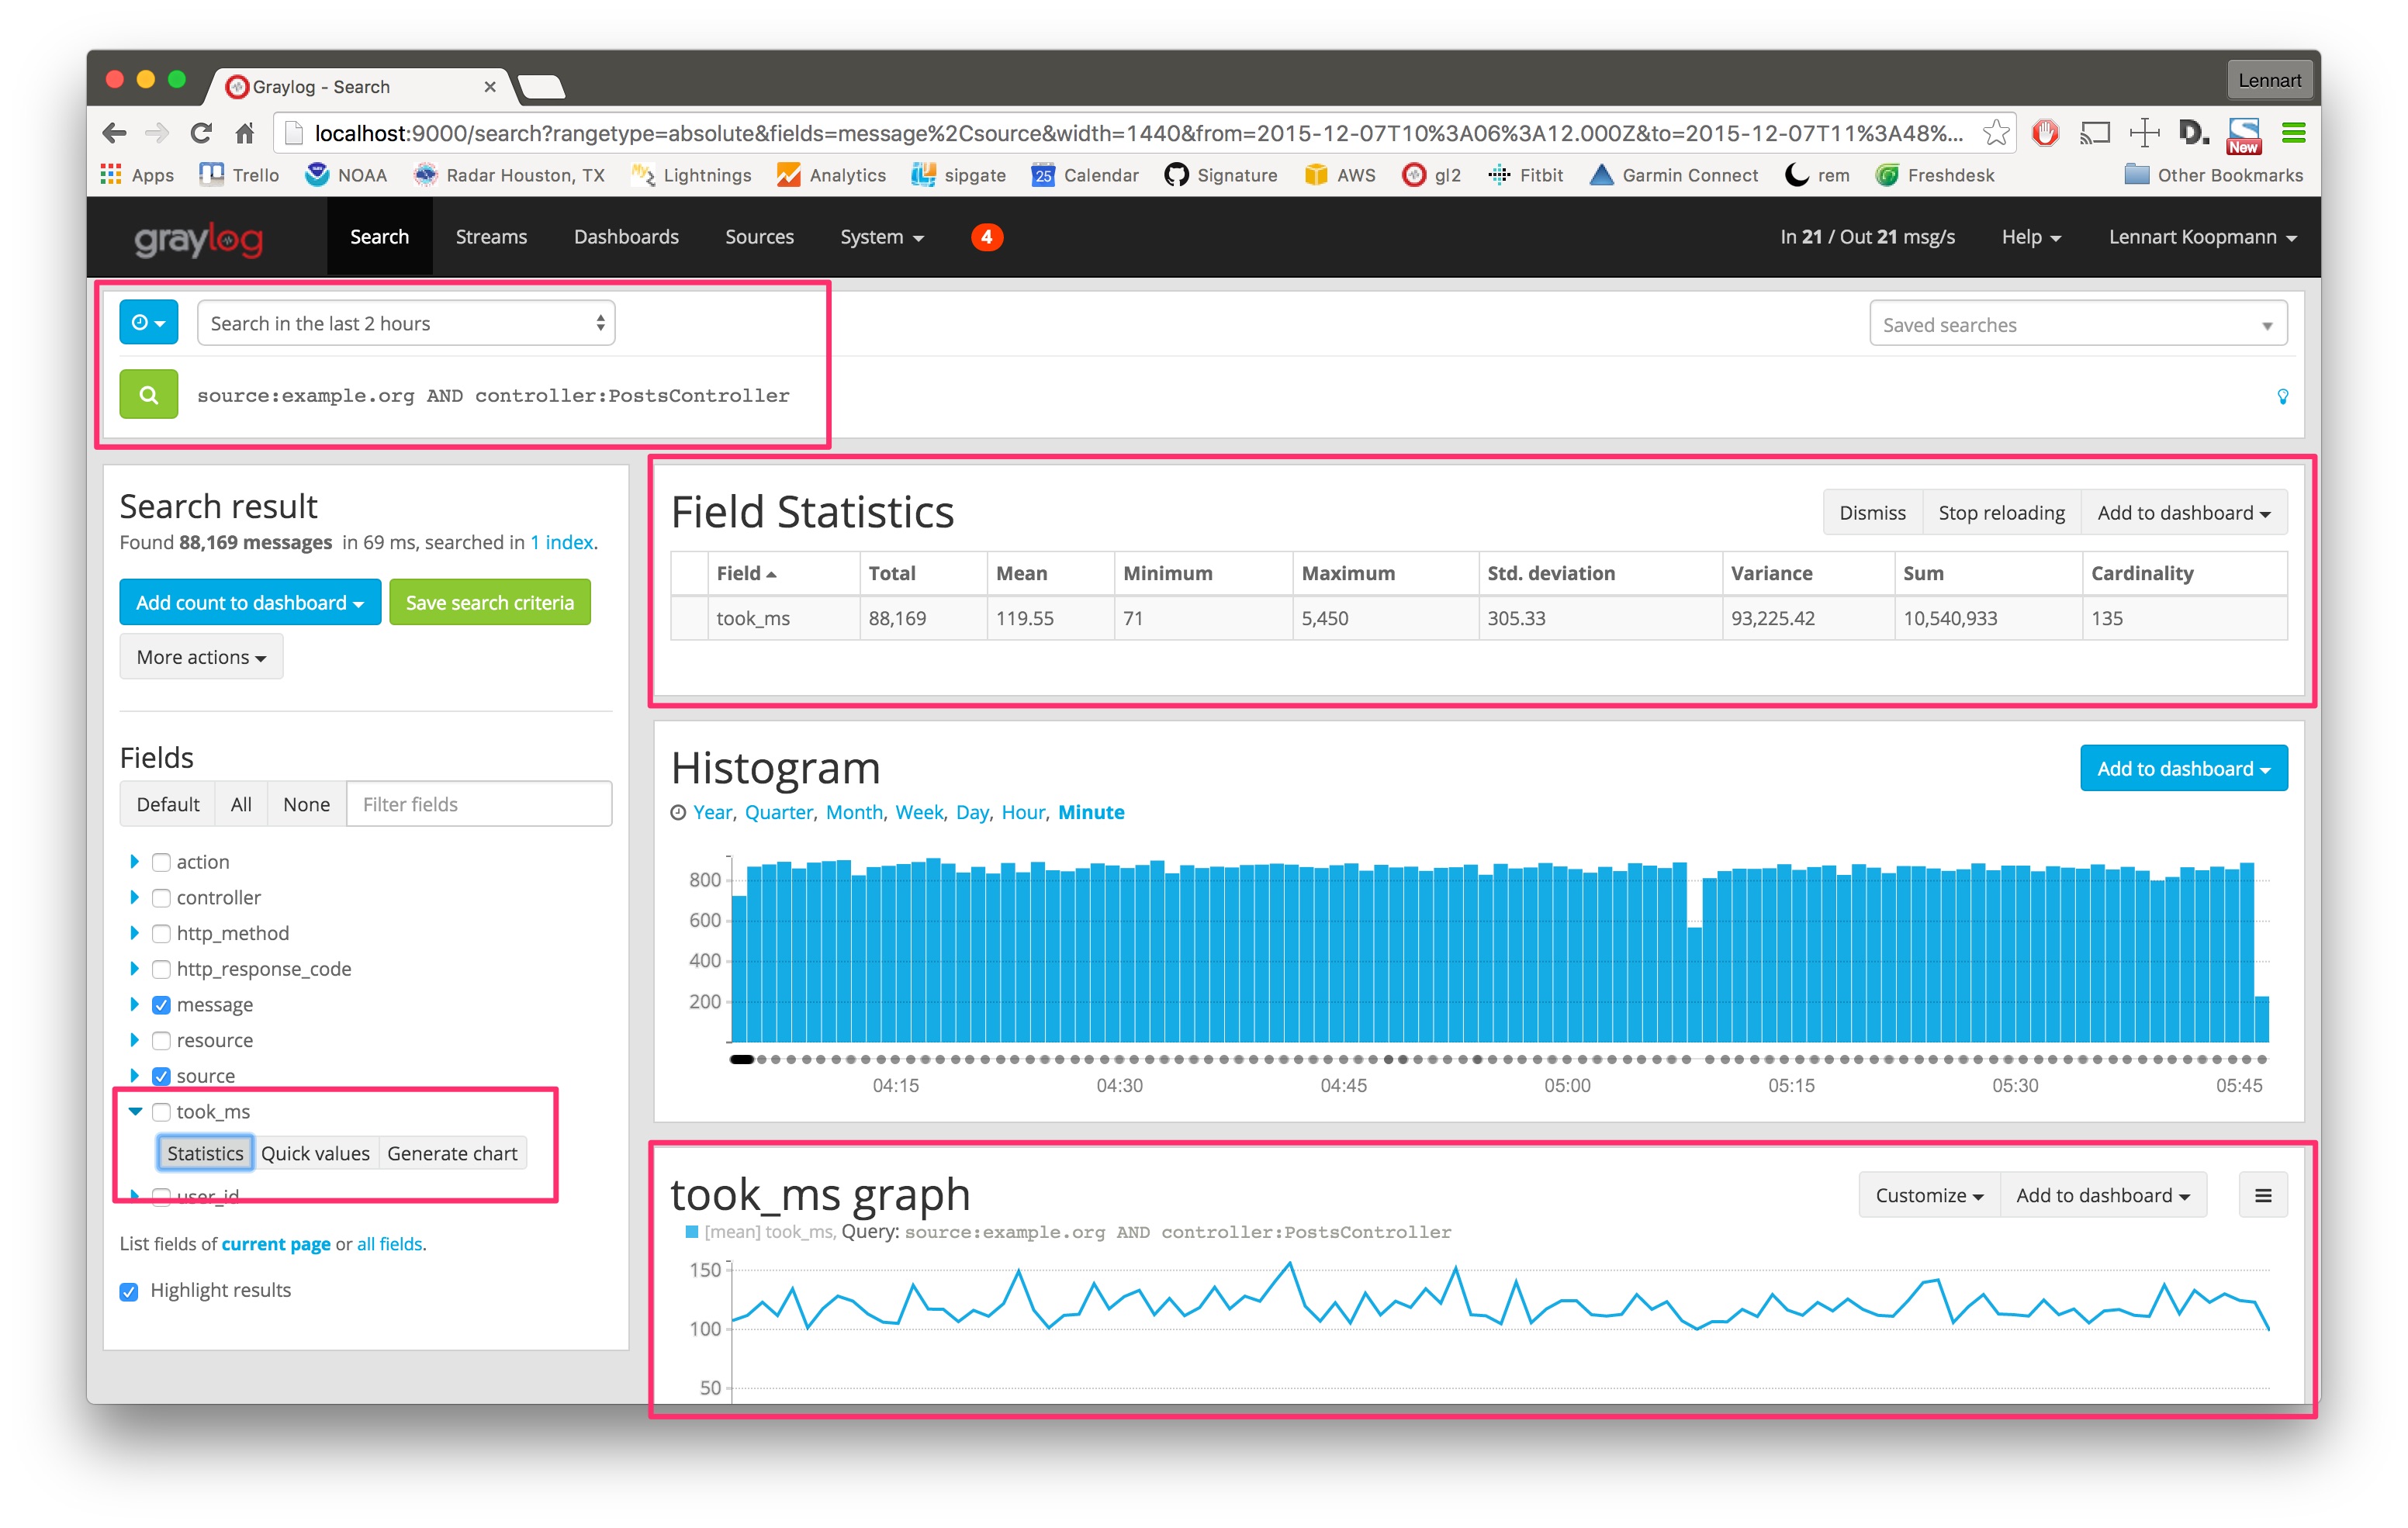
The took_ms field includes a number that represents the milliseconds it took to handle the HTTP request that was logged. The field statistics show you statistical information about the field value (in the last 2 hours in this case - look at the time range selector).
The Generate chart button will create a chart representing the field value over time. You can see that the response time of this specific part of your application (controller:PostsController) did not change much in the last 2 hours. You can also see that the field statistics are accurate: Standard deviation is around 305ms and the mean value is 119ms.
Create a dashboard
Dashboards are a great way to organize information that you look at often. Learn how to create them and how to add widgets with interesting information.
This guide assumes that you have successfully completed and understood the sections before it. By now, you have log messages flowing into Graylog, and are familiar with the basic search and analysis functionality.
Be alerted
Immediately receive alerts and trigger actions when something interesting or unusual happens.
An alert is always based on a stream. Set up streams that categorize and group messages so you can later alert on aggregated metrics. Streams could be Failed SSH logins, HTTP 500’s, blocked ICMP packages or All HTTP requests (to measure response time).
The Graylog Extended Log Format (GELF)
Graylog also introduces the Graylog Extended Log Format (GELF), which improves on the limitations of standard syslog, such as:
-
Limited to length of 1024 bytes. Inadequate space for payloads like backtraces.
-
No data types in structured syslog. Numbers and strings are indistinguishable.
-
The RFCs are strict enough, but there are too many syslog dialects to parse them all.
-
No compression.
Improvements on these issues make GELF a better choice for logging from within applications. The Graylog Marketplace offers libraries and appenders for easily implementing GELF in many programming languages and logging frameworks. Also, GELF can be sent via UDP so it cannot break your application from within your logging class.
For more information please refer to Parsing Log Files in Graylog.
The Basis: Graylog + Data Node + MongoDB
Log data is stored in a data node, either Elasticsearch or OpenSearch. Both are open source search engines. Your data node allows you to index and search through all the messages in your Graylog message database.
This combination grants users the ability to conduct an in depth analysis of petabytes of data. Because your data is accessible to your data node you are not dependent on a third party search tool. This also means that you have great flexibility in customizing your own search queries. You also have access to the many open-source projects and tools provided by Elasticsearch or OpenSearch.
The Graylog Server component sits in the middle and works around your data node which is a full text search engine and not a log management system. It also builds an abstraction layer on top of it to make data access as easy as possible without having to select indices and write tedious time range selection filters, etc. Just submit the search query and Graylog will take care of the rest for you.
Graylog uses MongoDB to store data. Only metadata such as user information and stream configurations are stored here, not log data. So MongoDB will not have a huge system impact. It runs alongside the Graylog server processes and takes up minimal space.
Community and Resources
The Graylog Community is 8,000 members strong. These Graylog users make valuable contributions to the product by asking questions, offering input for better performance, and providing support for fellow community members.
The Graylog Marketplace is where you can find plugins, extensions, content packs, a GELF library, and other solutions contributed by developers and community members.
Planning Your Deployment
There are a few rules of thumb when scaling resources for Graylog:
-
Graylog nodes should have a focus on CPU power. These also serve the user interface to the browser.
-
Elasticsearch/OpenSearch nodes should have as much RAM as possible and the fastest disks you can get. Everything depends on I/O speed here.
-
MongoDB is storing meta information and configuration data and doesn’t need many resources.
Also keep in mind that ingested messages are only stored in Elasticsearch. If you have data loss in the Elasticsearch cluster, the messages are gone - except if you have created backups of the indices.
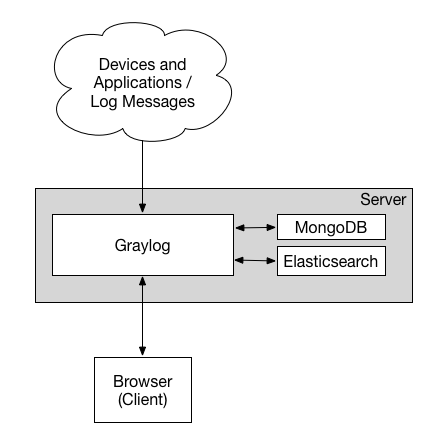
Minimum Setup
This is a minimum Graylog setup that can be used for smaller, non-critical, or test setups. None of the components are redundant, and they are easy and quick to setup.
Bigger Production Setup
This is a setup for bigger production environments. It has several Graylog nodes behind a load balancer distributing the processing load. The load balancer can ping the Graylog nodes via on the Graylog REST API to check if they are alive and take dead nodes out of the cluster.
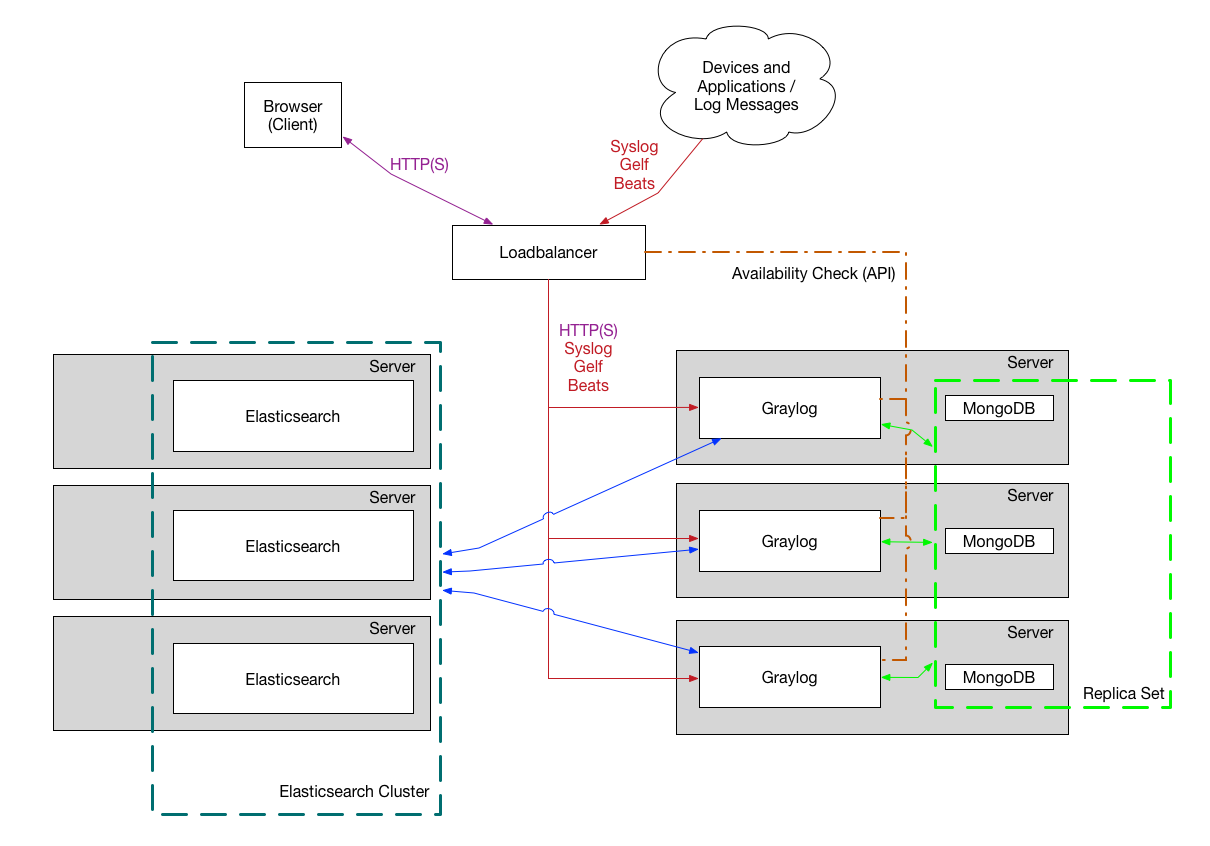
How to plan and configure such a setup is covered in our Multi-node Setup guide. Some guides on the Graylog Marketplace also offer some ideas how you can use RabbitMQ (AMQP) or Apache Kafka to add some queuing to your setup.
Planning Your Log Collection
Collection Methods
A decision must be made as to how the logs will be collected. After a list of event sources have been determined, the next step is to decide the method of collection for each source. It is critical to understand what method each event source uses and what resources may be required.
For example, if a log shipper will be required to read logs from a local file on all servers, the log shipper must be selected and tested before deployment. In other cases, proprietary APIs or software tools must be employed and integrated. In some cases, changes to the event sources themselves (security devices, network hardware, or applications) may be required. Additional planning is often required to deploy and maintain these collection methods over time.
Graylog supports many input types out of the box and many more are available in Graylog Marketplace. A list of input types that Graylog supports can be found in the Getting Started Guide.
A successful, well planned collection of messages is the first step in enabling the user to gain the most benefit from Graylog. For step by step instruction on how to get your logs into Graylog, please see this video.
Deployment Options
Containers
Graylog supports Docker for the deployment of Graylog, MongoDB, and Elasticsearch. Please see the Docker installation page for instructions.
Initial Configuration Settings
Configurations must be set for Graylog to start after installation. Both the Graylog server.conf and Elasticsearch elasticsearch.yml configuration files contain the key details needed for initial configuration.
server.conf
The file server.conf is the Graylog configuration file. The default location for server.conf is: /etc/graylog/server/server.conf.
Web Properties
http_bind_address = 127.0.0.1:9000- The network interface used by the Graylog HTTP interface.
- This address and port is used by default in the
http_publish_uri.
Elasticsearch Properties
elasticsearch_hosts = https://node1:9200,https://user:password@node2:19200- List of Elasticsearch hosts Graylog should connect to.
- Need to be specified as a comma-separated list of valid URIs for the HTTP ports of Elasticsearch nodes.
- If one or more Elasticsearch hosts require authentication, include the credentials in each node URI that requires authentication.
- Default:
https://127.0.0.1:9200You may retain the default setting only if Elasticsearch is installed on the same host as the Graylog server.
MongoDB
mongodb_uri = mongdb://...- MongoDB connection string. Enter your MongoDB connection and authentication information here.
- See https://docs.mongodb.com/manual/reference/connection-string/ for details.
- Examples:
- Simple:
mongodb_uri = mongodb://localhost/graylog - Authenticate against the MongoDB server:
mongodb_uri = mongodb://grayloguser:secret@localhost:27017/graylog - Use a replica set instead of a single host:
mongodb_uri=mongodb://grayloguser:secret@localhost:27017,localhost:27018,localhost:27019/graylog?replicaSet=rs01
- Simple:
elasticsearch.yml
Elasticsearch.yml is the Elasticsearch configuration file. The default location for Elasticsearch.yml is: /etc/elasticsearch/elasticsearch.yml.
Several values must be properly configured for Elasticsearch to work properly.
cluster.name: graylog- This value may be set to anything the customer wishes, though we recommend using “graylog”.
- This value must be the same for every Elasticsearch node in a cluster.
network.host: 172.30.4.105- By default, Elasticsearch only binds to loop-back addresses (e.g., 127.0.0.1). This is sufficient to run a single development node on a server.
- To communicate and form a cluster with nodes on other servers, the node will need to bind to a non-loopback address.
http.port: 9200- Port Elasticsearch will listen on. We recommend the default value.
discovery.zen.ping.unicast.hosts: ["es01.acme.org", "es02.acme.org"]- Elasticsearch uses a custom discovery implementation called “Zen Discovery” for node-to-node clustering and leader election. To form a cluster with nodes on other servers, provide a seed list of other nodes in the cluster that are likely to be live and contactable.
- May be specified as an IP address or FQDN.
Index Model
Graylog transparently manages one or more sets of Elasticsearch/OpenSearch indices to optimize search and analysis operations for speed and low resource consumption.
To enable managing indices with different mappings, analyzers, and replication settings, Graylog uses index sets, which are an abstraction of all these settings. For information on index default configuration settings, see Index Defaults.
Rest API
The functionality Graylog REST API is very comprehensive; even the Graylog web interface is exclusively using Graylog REST API to interact with the Graylog cluster.
To connect to the Graylog REST API with a web browser, just add api/api-browser to your current http_publish_uri setting or use the API browser button on the nodes overview page (System / Nodes in the web interface).
For example if your Graylog REST API is listening on https://192.168.178.26:9000/api/, the API browser will be available at https://192.168.178.26:9000/api/api-browser/.
GELF
The Graylog Extended Log Format (GELF) is a log format that avoids the shortcomings of classic plain syslog:
- Limited to length of 1024 bytes. Inadequate space for payloads like backtraces.
- No data types in structured syslog. Numbers and strings are indistinguishable.
- The RFCs are strict enough, but there are so many syslog dialects out there that you cannot possibly parse all of them.
- No compression.
Syslog is sufficient for logging system messages of machines or network gear, while GELF is a strong choice for logging from within applications. There are libraries and appenders for many programming languages and logging frameworks, so it is easy to implement. GELF can send every exception as a log message to your Graylog cluster without complications from timeouts, connection problems, or anything that may break your application from within your logging class because GELF can be sent via UDP.
GELF Payload Specification
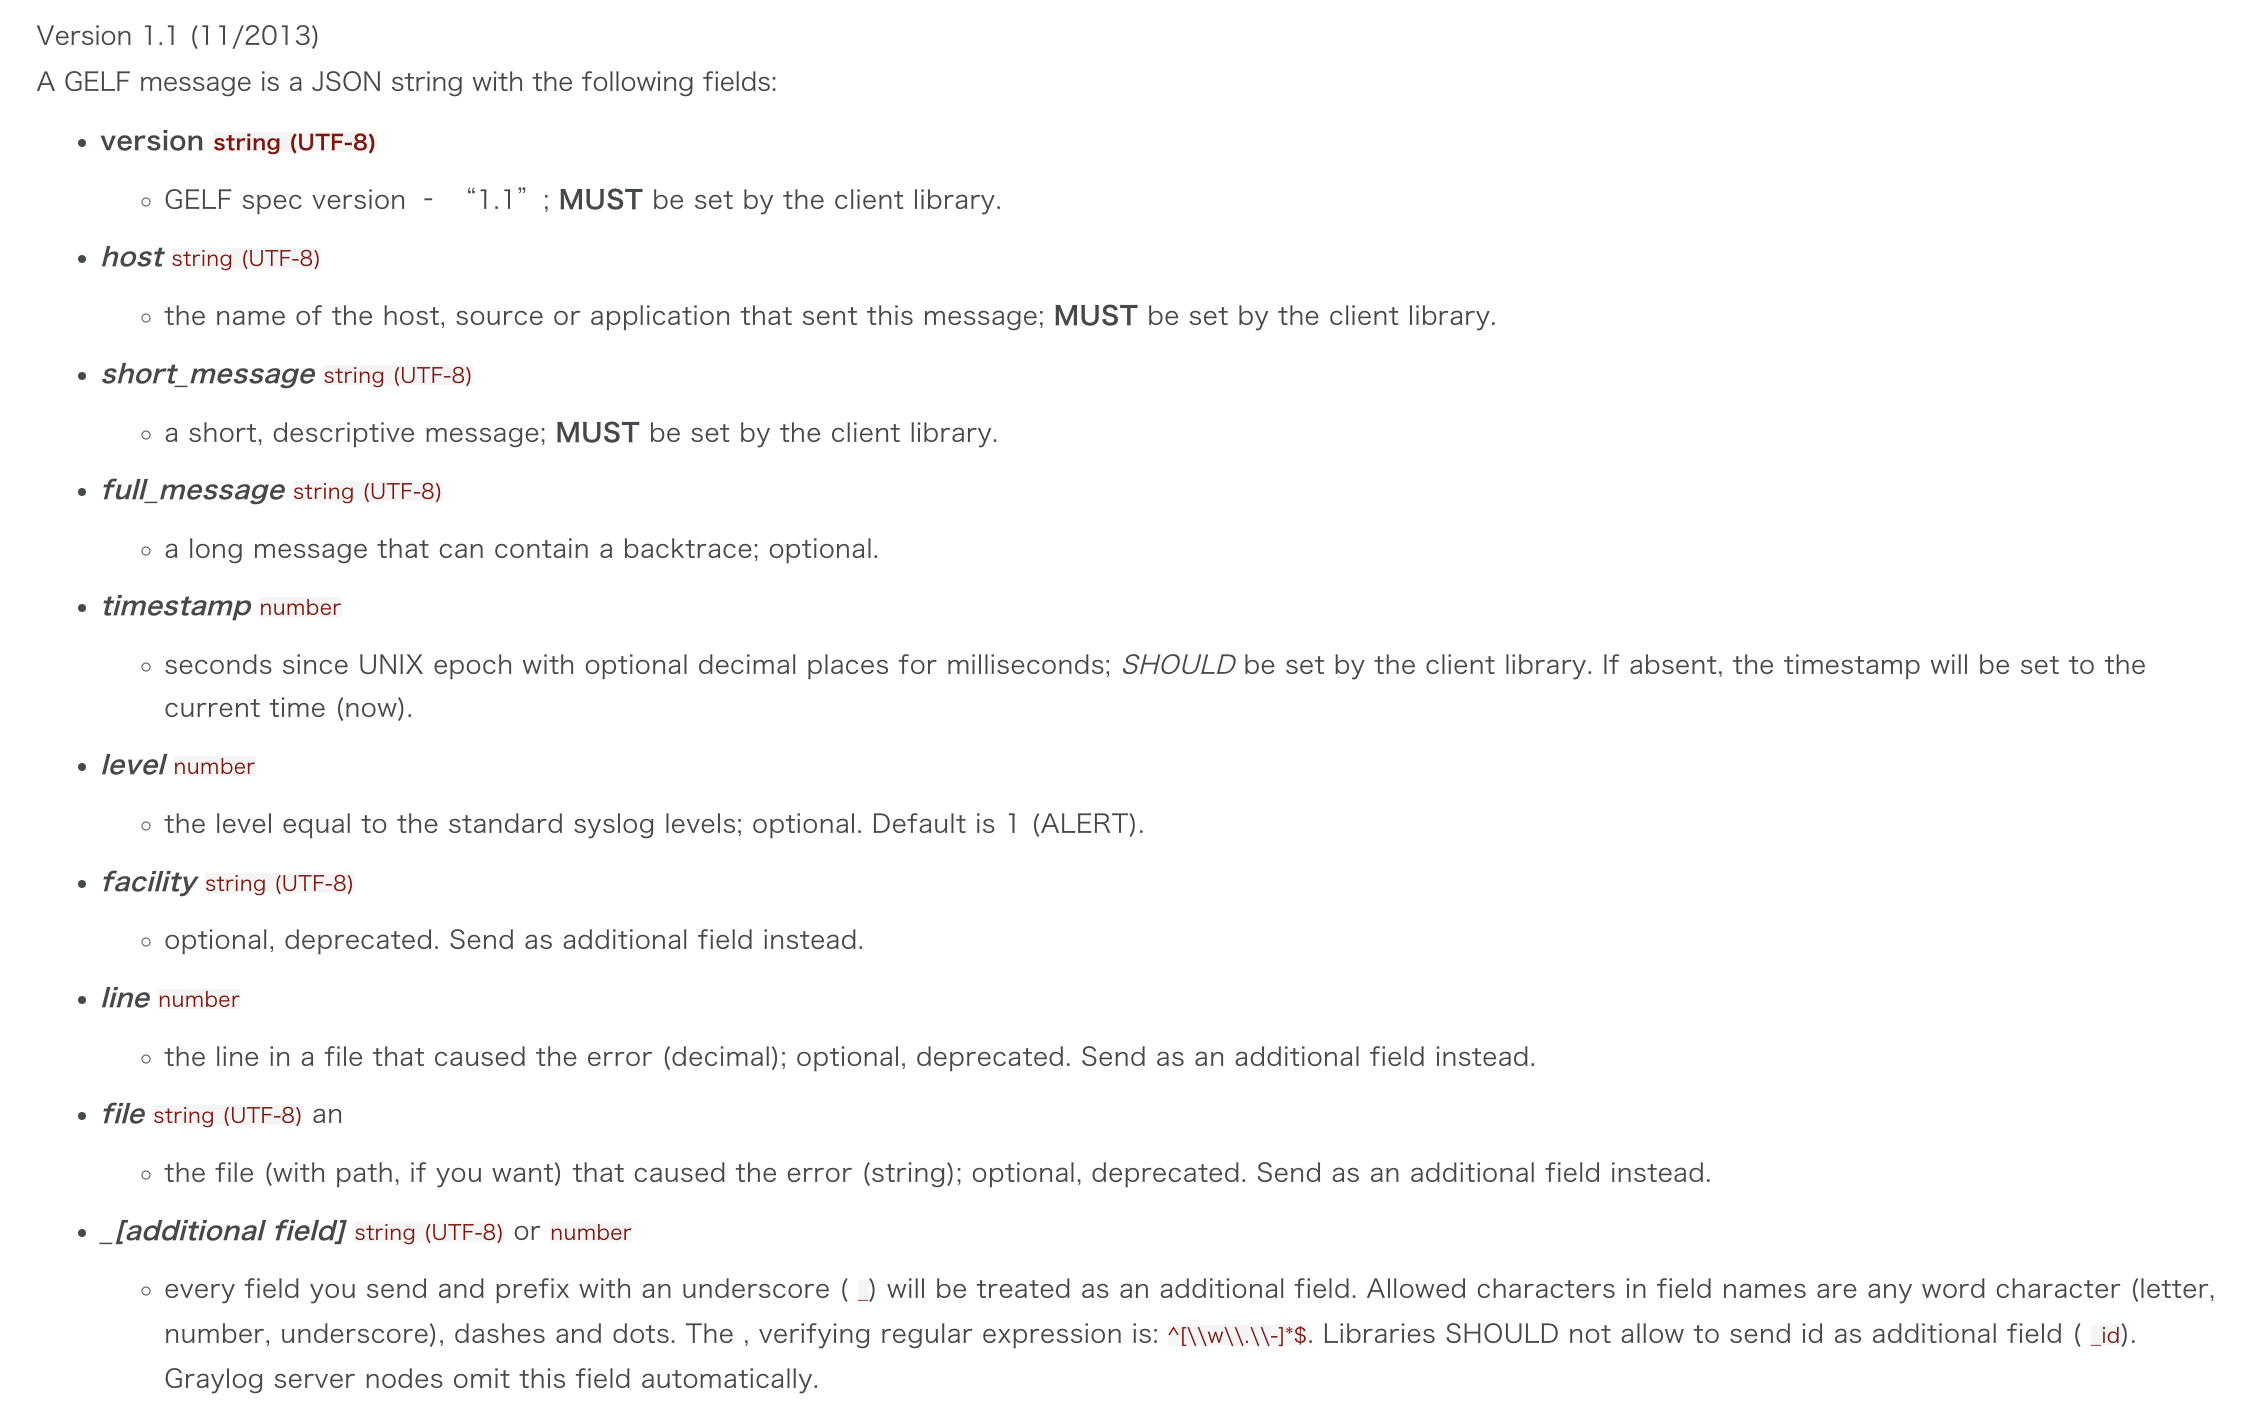
Example Payload
This is an example GELF message payload. Any Graylog-server node accepts and stores this as a message when GZIP/ZLIB is compressed or even when sent uncompressed over a plain socket without new lines.
Hint: New lines must be denoted with the \n escape sequence to ensure the payload is valid JSON as per RFC 7159.
{
    "version": "1.1",
    "host": "example.org",
    "short_message": "A short message that helps you identify what is going on",
    "full_message": "Backtrace here\n\nmore stuff",
    "timestamp": 1385053862.3072,
    "level": 1,
    "_user_id": 9001,
    "_some_info": "foo",
    "_some_env_var": "bar"
}
Hint: Currently, the server implementation of GELF in Graylog does not support boolean values. Boolean values will be dropped on ingest (for reference).
Sending GELF Messages via UDP Using Netcat
Sending an example message to a GELF UDP input (running on host graylog.example.com on port 12201):
echo -n '{ "version": "1.1", "host": "example.org", "short_message": "A short message", "level": 5, "_some_info": "foo" }' | nc -w0 -u graylog.example.com 12201
Sending GELF Messages via TCP Using Netcat
Sending an example message to a GELF TCP input (running on host graylog.example.com on port 12201):
echo -n -e '{ "version": "1.1", "host": "example.org", "short_message": "A short message", "level": 5, "_some_info": "foo" }'"\0" | nc -w0 graylog.example.com 12201
Sending GELF Messages Using Curl
Sending an example message to a GELF input (running on https://graylog.example.com:12201/gelf):
curl -X POST -H 'Content-Type: application/json' -d '{ "version": "1.1", "host": "example.org", "short_message": "A short message", "level": 5, "_some_info": "foo" }' 'http://graylog.example.com:12201/gelf'
Graylog Sidecar
Graylog Sidecar is a lightweight configuration management system for log collectors, which are also called backends. These collectors ingest data through inputs. An input can be a log file that the collector continuously reads or a connection to the Windows event system that emits log events. The Graylog node(s) acts as a centralized hub containing the configurations of log collectors. On supported message-producing devices/hosts, sidecar can run as a service (Windows host) or daemon (Linux host).
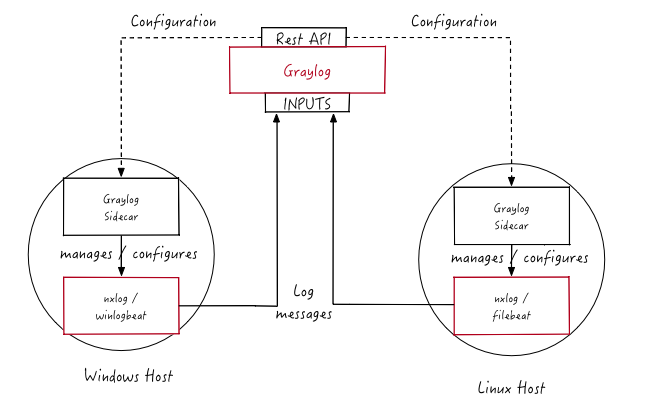
Log collector configurations are centrally managed through the Graylog web interface. Periodically, the sidecar daemon will fetch all relevant configurations for the target, using the REST API. On its first run or when a configuration change has been detected, sidecar will generate (render) relevant backend configuration files. Then it will start or restart those reconfigured log collectors.
Searching Your Log Data
The search page serves as the central hub of Graylog, where you can execute searches (queries) and visualize the results using a wide range of widgets. Any search can be saved or exported as a dashboard, allowing for easy reuse of specific search configurations. Dashboards offer the flexibility of widget-specific search queries and can be shared with others to enhance their work-flows. To further enhance the workflow, parameters can also be incorporated into the search query.
Writing Search Queries
Syntax
The search syntax is very close to the Lucene syntax. By default all message fields are included in the search if you don’t specify a message field to search in.
- Messages that include the term
ssh:
ssh
- Messages that include the term
sshorlogin:
ssh login
- Messages that include the exact phrase
ssh login:
"ssh login"
- Messages where the field
typeincludesssh:
type:ssh
- Messages where the field
typeincludessshorlogin:
type:(ssh OR login)
Hint: Elasticsearch 2.x and 5.x split queries on whitespace, so the query
type:(ssh login)was equivalent totype:(ssh OR login). This is no longer the case in Elasticsearch 6.0 and you must now include anORoperator between each term.
- Messages where the field
typeincludes the exact phrasessh login:
type:"ssh login"
- Messages that have the field
type:
_exists_:type
- Messages that do not have the field type :
NOT _exists_:type
Hint: Elasticsearch 2.x allows to use
_missing_:typeinstead ofNOT _exists_:type. This query syntax has been removed in Elasticsearch 5.0 .
- Messages that match regular expression
ethernet[0-9]+:
/ethernet[0-9]+/
Hint: Please refer to the Elasticsearch documentation about the Regular expression syntax for details about the supported regular expression dialect.
- By default all terms or phrases are
ORconnected so all messages that have at least one hit are returned. You can use Boolean operators and groups for control over this:
"ssh login" AND source:example.org
("ssh login" AND (source:example.org OR source:another.example.org)) OR _exists_:always_find_me
- You can also use the
NOToperator:
"ssh login" AND NOT source:example.org
NOT example.org
Note that AND, OR, and NOT are case sensitive and must be typed in all upper-case.
- Wildcards: Use
?to replace a single character or*to replace zero or more characters:
source:*.org
source:exam?le.org
source:exam?le.*
- Note that leading wildcards are disabled to avoid excessive memory consumption! You can enable them in your Graylog configuration file:
allow_leading_wildcard_searches = true
Escaping
The following characters must be escaped with a backslash:
& | : \ / + - ! ( ) { } [ ] ^ " ~ * ?
Example:
resource:\/posts\/45326
Error Types
When entering your queries be sure to look out for warning and exceptions. If you enter a query Graylog won’t understand, an icon with a yellow exclamation mark appears along with a message with the warning or exception. They include:
-
Parse exception - This exception is thrown when a parsing errors occurs. This appears when you make an error in the syntax of your search query. The error message should contain more information about the position of the syntax error.
-
Invalid operator - This occurs when the operator is misspelled. For example, AND is a valid operator but and is not. In most cases, operators are uppercase.
-
Unknown field - This warning occurs when you include a field in your search query that does not exist in the involved index sets. This is determined by the relationship between streams and index sets.
-
Parameter error - This error occurs when you are using an undeclared parameter in your search query. Parameters need to be defined before you can include them in your search.
Frequently Asked Questions
What is MongoDB used for?
Graylog uses MongoDB to store your configuration data, not your log data. Only metadata is stored, such as user information or stream configurations. None of your log messages are ever stored in MongoDB. This is why MongoDB does not have a big system impact, and you won’t have to worry too much about scaling it. With our recommended setup architecture, MongoDB will simply run alongside your graylog-server processes and use almost no resources.
Does Graylog encrypt log data?
All log data is stored in Elasticsearch/OpenSearch. Elastic recommends you use dm-crypt at the file system level.
Where are the log files Graylog produces?
You can find the log data for Graylog under the below directory with timestamps and levels and exception messages. This is useful for debugging or when the server won’t start.
/var/log/graylog-server/server.log
If you use the pre-build appliances, take a look into
/var/log/graylog/<servicename>/current
How do I find out if a specific log source is supported?
We support many log sources - and more are coming everyday. For a complete list, check out Graylog Marketplace, the central repository of Graylog extensions. There are 4 types of content on the Marketplace:
-
Plug-Ins: Code that extends Graylog to support a specific use case that it doesn’t support out of the box.
-
Content Pack: A file that can be uploaded into your Graylog system that sets up streams, inputs, extractors, dashboards, etc. to support a given log source or use case.
-
GELF Library: A library for a programming language or logging framework that supports sending log messages in GELF format for easy integration and pre-structured messages.
-
Other Solutions: Any other content or guide that helps you integrate Graylog with an external system or device. For example, how to configure a specific device to support a format Graylog understands out of the box.
Can Graylog automatically clean old data?
Absolutely we have data retention features.
Can I filter inbound messages before they are processed by the Graylog server?
Yes, check out our page on how to use blacklisting.
What is the best way to integrate my applications to Graylog?
We recommend that you use GELF. It’s easy for your application developers and eliminates the need to store the messages locally. Also, GELF can just send what app person wants so you don’t have to build extractors or do any extra processing in Graylog.
I don’t want to use Elasticsearch/OpenSearch as my backend storage system - can I use another database, like MySQL, Oracle, etc?
Currently you can’t. We only recommend another database if you want it for secondary storage.
I’m sending in messages, and I can see they are being accepted by Graylog, but I can’t see them in the search. What is going wrong?
A common reason for this issue is that the timestamp in the message is wrong. First, confirm that the message was received by selecting all messages as the time range for your search. Then identify and fix the source that is sending the wrong timestamp.
Elasticsearch REST APIs
https://www.elastic.co/guide/en/elasticsearch/reference/current/rest-apis.html
检查 es 状态
curl domain-endpoint:9200/_cluster/health?pretty=true
输出:
{
  "cluster_name" : "smges-sh",
  "status" : "green",
  "timed_out" : false,
  "number_of_nodes" : 5,
  "number_of_data_nodes" : 2,
  "active_primary_shards" : 30,
  "active_shards" : 44,
  "relocating_shards" : 0,
  "initializing_shards" : 0,
  "unassigned_shards" : 0,
  "delayed_unassigned_shards" : 0,
  "number_of_pending_tasks" : 0,
  "number_of_in_flight_fetch" : 0,
  "task_max_waiting_in_queue_millis" : 0,
  "active_shards_percent_as_number" : 100.0
}
查询 es 的索引
curl domain-endpoint:9200/_cat/indices?v
输出
health status index                            uuid                   pri rep docs.count docs.deleted store.size pri.store.size
green  open   .apm-agent-configuration         Q5E3ideATBqXmvgW7DE4CA   1   1          0            0       416b           208b
green  open   gl-events_0                      hYyhOftdQG6Bfy9Ijewcsw   4   0          0            0       832b           832b
green  open   .opendistro_security             AKJSa1BzRkqaGnLtyi3bEw   1   1          9            0    117.8kb         58.9kb
green  open   .kibana_1                        wXujvxi_Ta2Hzg7_zl2ZGg   1   1        105           12      4.2mb          2.1mb
green  open   .apm-custom-link                 l6kb6uWGSAOvwlN4KQDD8w   1   1          0            0       416b           208b
green  open   jlib_log_index_prefix_20240716_1 _0MqNl8lRSeQ4TnjkYFm1g   4   0          0            0       832b           832b
green  open   jlib_log_index_prefix_20240716_0 8mNp1ZQPQbWJE6QszuGrag   4   0          0            0       832b           832b
green  open   .kibana_task_manager_1           mWqmJbsiT1qijTj2w1x4XQ   1   1          5       755163    118.6mb         59.2mb
green  open   .kibana-event-log-7.10.2-000004  wBTekoeIS06C_BZlA5gwEw   1   1          0            0       416b           208b
green  open   gl-system-events_0               f3-ypVVCR_yIioh2WDzalg   4   0          0            0       832b           832b
green  open   graylog_deflector                x1i1_aMQR12wgjm_hd0CbQ   1   1  120903091            0     48.4gb         24.2gb
green  open   .kibana-event-log-7.10.2-000001  ZnV__tPvQ_2CSDJcgyS18A   1   1          1            0     11.2kb          5.6kb
green  open   .kibana-event-log-7.10.2-000002  SCp4U_CwQ0GeHjoIiUhDBg   1   1          0            0       416b           208b
green  open   .kibana-event-log-7.10.2-000003  6_S_kUt1QOyAnNqEtANTKA   1   1          0            0       416b           208b
删除 es 的索引
curl -XDELETE domain-endpoint:9200/graylog_deflector
查询 es 的存储空间
curl domain-endpoint:9200/_cat/allocation?v
输出
shards     disk.indices disk.used disk.avail disk.total       disk.percent   host         ip           node
    21       74.4mb     7.1gb     41.9gb       49gb           14             9.143.87.196 9.143.87.196 dn-9.143.87.196
    21       75.2mb     9.9gb     39.1gb       49gb           20             11.147.239.2 11.147.239.2 dn-11.147.239.2
列出 es 未分配的分片
$ curl -XGET 'domain-endpoint/_cat/shards?h=index,shard,prirep,state,unassigned.reason' | grep UNASSIGNED
输出
% Total    % Received % Xferd  Average Speed   Time    Time     Time  Current
                                 Dload  Upload   Total   Spent    Left  Speed
100    12  100    12    0     0    531      0 --:--:-- --:--:-- --:--:--   545
修改 es 的配置
curl -X PUT "smges:smges_dAqlkS@smges-sh.physic-sh.es.svr.ehk.db:9200/_cluster/settings" -H 'Content-Type: application/json' -d'
{
  "persistent": {
    "action.auto_create_index": "false"
  }
}'
查询 es 的配置
curl -XGET "smges:smges_dAqlkS@smges-sh.physic-sh.es.svr.ehk.db:9200/_cluster/settings"
Graylog 问题定位
How do I fix the “Deflector exists as an index and is not an alias” error message?
Graylog is using an Elasticsearch index alias per index set pointing to the active write index, the so-called deflector, to write messages into Elasticsearch such as graylog_deflector in the default index set.
Please refer to Index model for a more in-depth explanation of the Elasticsearch index model used by Graylog.
In some rare situations, there might be an Elasticsearch index with a name which has been reserved for the deflector of an index set managed by Graylog, so that Graylog is unable to create the proper Elasticsearch index alias.
修复方法:
- Stop all Graylog nodes
- (OPTIONAL ) If you want to keep the already ingested messages, reindex them into the Elasticsearch index with the greatest number, e.g.
graylog_23if you want to fix the deflectorgraylog_deflector, via the Elasticsearch Reindex API. - Delete the
graylog_deflectorindex via the Elasticsearch Delete Index API. - Add
action.auto_create_index: falseto the configuration files of all Elasticsearch nodes in your cluster and restart these Elasticsearch nodes, see Elasticsearch Index API - Automatic Index Creation and Creating an Index for details. (实际验证,不需要重启 es,可以通过 Restful 的方式更新 es 配置) - Start the Graylog leader node.
Manually rotate the active write index of the index set on the System / Indices / Index Set page in the
Maintenancedrop down menu. - (OPTIONAL ) Start all remaining Graylog follower nodes.
curl -X PUT "smges:smges_dAqlkS@smges-sh.physic-sh.es.svr.ehk.db:9200/_cluster/settings" -H 'Content-Type: application/json' -d'
{
  "persistent": {
    "action.auto_create_index": "false"
  }
}'
其他参考:
- How to fix “Deflector exists as an index and is not an alias” warning?
- Deflector exists as an index and is not an alias. #4355
- graylog deflector is used before elasticsearch report back success #4167
- graylog es 故障问题相关问题解决
Refer
- graylog 4.3
- https://go2docs.graylog.org/4-3/home.htm (技术文档)
- https://go2docs.graylog.org/4-3/planning_your_deployment/faq.html
- https://go2docs.graylog.org/5-2/what_is_graylog/what_is_graylog.htm
- https://github.com/Graylog2/graylog2-server
- https://go2docs.graylog.org/current/making_sense_of_your_log_data/writing_search_queries.html