CPP Unitest
- 单元测试方案对比
- CMake with unitest
- GoogleTest - Google Testing and Mocking Framework
- doctest
- gcov - a Test Coverage Program
- Clang Source-based Code Coverage
- Q&A
单元测试方案对比
| Name | License | Macros | Mocks | Remarks |
|---|---|---|---|---|
| Boost Test Library | Boost | User decision | With additional library Turtle | Part of Boost. Powerful dataset concept for generating test cases. Different levels of fixtures (global, once per test suite, once per each test case in a suite). Powerful floating point comparison. |
| Catch or Catch2 | Boost | Yes | No | Header only, no external dependencies, auto-registration, tdd and bdd features |
| Google Test | BSD | Yes | Yes | Supports automatic test discovery, a rich set of assertions, user-defined assertions, death tests, fatal and non-fatal failures, various options for running the tests, and XML test report generation. |
| doctest | N/A | Yes | No | A new C++ testing framework but is by far the fastest both in compile times and runtime compared to other feature-rich alternatives. |
refer: https://en.wikipedia.org/wiki/List_of_unit_testing_frameworks#C++
CMake with unitest
CMake: Project structure with unit tests
GoogleTest - Google Testing and Mocking Framework
googletest helps you write better C++ tests.
googletest is a testing framework developed by the Testing Technology team with Google’s specific requirements and constraints in mind. Whether you work on Linux, Windows, or a Mac, if you write C++ code, googletest can help you. And it supports any kind of tests, not just unit tests.
refer:
Googletest Primer
Introduction: Why googletest?
So what makes a good test, and how does googletest fit in? We believe:
-
Tests should be independent and repeatable. It’s a pain to debug a test that succeeds or fails as a result of other tests. googletest isolates the tests by running each of them on a different object. When a test fails, googletest allows you to run it in isolation for quick debugging.
-
Tests should be well organized and reflect the structure of the tested code. googletest groups related tests into test suites that can share data and subroutines. This common pattern is easy to recognize and makes tests easy to maintain. Such consistency is especially helpful when people switch projects and start to work on a new code base.
-
Tests should be portable and reusable. Google has a lot of code that is platform-neutral; its tests should also be platform-neutral. googletest works on different OSes, with different compilers, with or without exceptions, so googletest tests can work with a variety of configurations.
-
When tests fail, they should provide as much information about the problem as possible. googletest doesn’t stop at the first test failure. Instead, it only stops the current test and continues with the next. You can also set up tests that report non-fatal failures after which the current test continues. Thus, you can detect and fix multiple bugs in a single run-edit-compile cycle.
-
The testing framework should liberate test writers from housekeeping chores and let them focus on the test content. googletest automatically keeps track of all tests defined, and doesn’t require the user to enumerate them in order to run them.
-
Tests should be fast. With googletest, you can reuse shared resources across tests and pay for the set-up/tear-down only once, without making tests depend on each other.
Beware of the nomenclature(命名法)
Note: There might be some confusion arising from different definitions of the terms
Test,Test CaseandTest Suite, so beware of misunderstanding these.
Historically, googletest started to use the term Test Case for grouping related tests, whereas current publications, including International Software Testing Qualifications Board (ISTQB) materials and various textbooks on software quality, use the term Test Suite for this.
googletest recently started replacing the term Test Case with Test Suite. The preferred API is TestSuite. The older TestCase API is being slowly deprecated and refactored away.
Basic Concepts
When using googletest, you start by writing assertions, which are statements that check whether a condition is true. An assertion’s result can be success, nonfatal failure, or fatal failure. If a fatal failure occurs, it aborts the current function; otherwise the program continues normally.
Tests use assertions to verify the tested code’s behavior. If a test crashes or has a failed assertion, then it fails; otherwise it succeeds.
A test suite contains one or many tests. You should group your tests into test suites that reflect the structure of the tested code. When multiple tests in a test suite need to share common objects and subroutines, you can put them into a test fixture class.
A test program can contain multiple test suites.
We’ll now explain how to write a test program, starting at the individual assertion level and building up to tests and test suites.
Assertions
googletest assertions are macros that resemble function calls. You test a class or function by making assertions about its behavior. When an assertion fails, googletest prints the assertion’s source file and line number location, along with a failure message. You may also supply a custom failure message which will be appended to googletest’s message.
The assertions come in pairs that test the same thing but have different effects on the current function. ASSERT_* versions generate fatal failures when they fail, and abort the current function. EXPECT_* versions generate nonfatal failures, which don’t abort the current function. Usually EXPECT_* are preferred, as they allow more than one failure to be reported in a test. However, you should use ASSERT_* if it doesn’t make sense to continue when the assertion in question fails.
Since a failed ASSERT_* returns from the current function immediately, possibly skipping clean-up code that comes after it, it may cause a space leak. Depending on the nature of the leak, it may or may not be worth fixing - so keep this in mind if you get a heap checker error in addition to assertion errors.
To provide a custom failure message, simply stream it into the macro using the << operator or a sequence of such operators. See the following example, using the ASSERT_EQ and EXPECT_EQ macros to verify value equality:
ASSERT_EQ(x.size(), y.size()) << "Vectors x and y are of unequal length";

for (int i = 0; i < x.size(); ++i) {
  EXPECT_EQ(x[i], y[i]) << "Vectors x and y differ at index " << i;
}
Anything that can be streamed to an ostream can be streamed to an assertion macro–in particular, C strings and string objects. If a wide string (wchar_t*, TCHAR* in UNICODE mode on Windows, or std::wstring) is streamed to an assertion, it will be translated to UTF-8 when printed.
GoogleTest provides a collection of assertions for verifying the behavior of your code in various ways. You can check Boolean conditions, compare values based on relational operators, verify string values, floating-point values, and much more. There are even assertions that enable you to verify more complex states by providing custom predicates. For the complete list of assertions provided by GoogleTest, see the Assertions Reference.
Simple Tests
To create a test:
- Use the
TEST()macro to define and name a test function. These are ordinary C++ functions that don’t return a value. - In this function, along with any valid C++ statements you want to include, use the various googletest assertions to check values.
- The test’s result is determined by the assertions; if any assertion in the test fails (either fatally or non-fatally), or if the test crashes, the entire test fails. Otherwise, it succeeds.
TEST(TestSuiteName, TestName) {
    // ... test body ...
}
TEST() arguments go from general to specific. The first argument is the name of the test suite, and the second argument is the test’s name within the test suite. Both names must be valid C++ identifiers, and they should not contain any underscores (_). A test’s full name consists of its containing test suite and its individual name. Tests from different test suites can have the same individual name.
For example, let’s take a simple integer function:
int Factorial(int n); // Returns the factorial of n
A test suite for this function might look like:
// Tests factorial of 0.
TEST(FactorialTest, HandlesZeroInput) {
  EXPECT_EQ(Factorial(0), 1);
}

// Tests factorial of positive numbers.
TEST(FactorialTest, HandlesPositiveInput) {
  EXPECT_EQ(Factorial(1), 1);
  EXPECT_EQ(Factorial(2), 2);
  EXPECT_EQ(Factorial(3), 6);
  EXPECT_EQ(Factorial(8), 40320);
}
googletest groups the test results by test suites, so logically related tests should be in the same test suite; in other words, the first argument to their TEST() should be the same. In the above example, we have two tests, HandlesZeroInput and HandlesPositiveInput, that belong to the same test suite FactorialTest.
When naming your test suites and tests, you should follow the same convention as for naming functions and classes.
Test Fixtures: Using the Same Data Configuration for Multiple Tests
If you find yourself writing two or more tests that operate on similar data, you can use a test fixture. This allows you to reuse the same configuration of objects for several different tests.
To create a fixture:
- Derive a class from
::testing::Test. Start its body withprotected:, as we’ll want to access fixture members fromsub-classes. - Inside the class, declare any objects you plan to use.
- If necessary, write a default constructor or
SetUp()function to prepare the objects for each test. A common mistake is to spellSetUp()as Setup() with a small u - Useoverridein C++11 to make sure you spelled it correctly. - If necessary, write a destructor or
TearDown()function to release any resources you allocated inSetUp(). To learn when you should use the constructor/destructor and when you should use SetUp()/TearDown(), read the FAQ. - If needed, define subroutines for your tests to share.
When using a fixture, use TEST_F() instead of TEST() as it allows you to access objects and subroutines in the test fixture:
TEST_F(TestFixtureName, TestName) {
    // ... test body ...
}
Like TEST(), the first argument is the test suite name, but for TEST_F() this must be the name of the test fixture class. You’ve probably guessed: _F is for fixture.
Unfortunately, the C++ macro system does not allow us to create a single macro that can handle both types of tests. Using the wrong macro causes a compiler error.
Also, you must first define a test fixture class before using it in a TEST_F(), or you’ll get the compiler error “virtual outside class declaration”.
For each test defined with TEST_F(), googletest will create a fresh test fixture at runtime, immediately initialize it via SetUp(), run the test, clean up by calling TearDown(), and then delete the test fixture. Note that different tests in the same test suite have different test fixture objects, and googletest always deletes a test fixture before it creates the next one. googletest does not reuse the same test fixture for multiple tests. Any changes one test makes to the fixture do not affect other tests.
As an example, let’s write tests for a FIFO queue class named Queue, which has the following interface:
template <typename E>  // E is the element type.
class Queue {
 public:
  Queue();
  void Enqueue(const E& element);
  E* Dequeue();  // Returns NULL if the queue is empty.
  size_t size() const;
  ...
};
First, define a fixture class. By convention, you should give it the name FooTest where Foo is the class being tested.
class QueueTest : public ::testing::Test {
 protected:
  void SetUp() override {
     q0_.Enqueue(1);
     q1_.Enqueue(2);
     q2_.Enqueue(3);
  }

  // void TearDown() override {}

  Queue<int> q0_;
  Queue<int> q1_;
  Queue<int> q2_;
};
In this case, TearDown() is not needed since we don’t have to clean up after each test, other than what’s already done by the destructor.
Now we’ll write tests using TEST_F() and this fixture.
TEST_F(QueueTest, IsEmptyInitially) {
  EXPECT_EQ(q0_.size(), 0);
}

TEST_F(QueueTest, DequeueWorks) {
  int* n = q0_.Dequeue();
  EXPECT_EQ(n, nullptr);

  n = q1_.Dequeue();
  ASSERT_NE(n, nullptr);
  EXPECT_EQ(*n, 1);
  EXPECT_EQ(q1_.size(), 0);
  delete n;

  n = q2_.Dequeue();
  ASSERT_NE(n, nullptr);
  EXPECT_EQ(*n, 2);
  EXPECT_EQ(q2_.size(), 1);
  delete n;
}
The above uses both ASSERT_* and EXPECT_* assertions. The rule of thumb is to use EXPECT_* when you want the test to continue to reveal more errors after the assertion failure, and use ASSERT_* when continuing after failure doesn’t make sense. For example, the second assertion in the Dequeue test is ASSERT_NE(n, nullptr), as we need to dereference the pointer n later, which would lead to a segfault when n is NULL.
When these tests run, the following happens:
- googletest constructs a
QueueTestobject (let’s call itt1). t1.SetUp()initializest1.- The first test (
IsEmptyInitially) runs ont1. t1.TearDown()cleans up after the test finishes.t1is destructed.- The above steps are repeated on another
QueueTestobject, this time running theDequeueWorkstest.
Invoking the Tests
TEST() and TEST_F() implicitly register their tests with googletest. So, unlike with many other C++ testing frameworks, you don’t have to re-list all your defined tests in order to run them.
After defining your tests, you can run them with RUN_ALL_TESTS(), which returns 0 if all the tests are successful, or 1 otherwise. Note that RUN_ALL_TESTS() runs all tests in your link unit–they can be from different test suites, or even different source files.
When invoked, the RUN_ALL_TESTS() macro:
-
Saves the state of all googletest flags.
-
Creates a test fixture object for the first test.
-
Initializes it via
SetUp(). -
Runs the test on the fixture object.
-
Cleans up the fixture via
TearDown(). -
Deletes the fixture.
-
Restores the state of all googletest flags.
-
Repeats the above steps for the next test, until all tests have run.
If a fatal failure happens the subsequent steps will be skipped.
IMPORTANT: You must not ignore the return value of
RUN_ALL_TESTS(), or you will get a compiler error. The rationale for this design is that the automated testing service determines whether a test has passed based on its exit code, not on its stdout/stderr output; thus yourmain()function must return the value ofRUN_ALL_TESTS().Also, you should call
RUN_ALL_TESTS()only once. Calling it more than once conflicts with some advanced googletest features (e.g., thread-safe death tests) and thus is not supported.
Writing the main() Function
Most users should not need to write their own main function and instead link with gtest_main (as opposed to with gtest), which defines a suitable entry point. See the end of this section for details. The remainder of this section should only apply when you need to do something custom before the tests run that cannot be expressed within the framework of fixtures and test suites.
If you write your own main function, it should return the value of RUN_ALL_TESTS().
You can start from this boilerplate(样板):
#include "this/package/foo.h"

#include "gtest/gtest.h"

namespace my {
namespace project {
namespace {

// The fixture for testing class Foo.
class FooTest : public ::testing::Test {
 protected:
  // You can remove any or all of the following functions if their bodies would
  // be empty.

  FooTest() {
     // You can do set-up work for each test here.
  }

  ~FooTest() override {
     // You can do clean-up work that doesn't throw exceptions here.
  }

  // If the constructor and destructor are not enough for setting up
  // and cleaning up each test, you can define the following methods:

  void SetUp() override {
     // Code here will be called immediately after the constructor (right
     // before each test).
  }

  void TearDown() override {
     // Code here will be called immediately after each test (right
     // before the destructor).
  }

  // Class members declared here can be used by all tests in the test suite
  // for Foo.
};

// Tests that the Foo::Bar() method does Abc.
TEST_F(FooTest, MethodBarDoesAbc) {
  const std::string input_filepath = "this/package/testdata/myinputfile.dat";
  const std::string output_filepath = "this/package/testdata/myoutputfile.dat";
  Foo f;
  EXPECT_EQ(f.Bar(input_filepath, output_filepath), 0);
}

// Tests that Foo does Xyz.
TEST_F(FooTest, DoesXyz) {
  // Exercises the Xyz feature of Foo.
}

}  // namespace
}  // namespace project
}  // namespace my

int main(int argc, char **argv) {
  ::testing::InitGoogleTest(&argc, argv);
  return RUN_ALL_TESTS();
}
The ::testing::InitGoogleTest() function parses the command line for googletest flags, and removes all recognized flags. This allows the user to control a test program’s behavior via various flags, which we’ll cover in the AdvancedGuide. You must call this function before calling RUN_ALL_TESTS(), or the flags won’t be properly initialized.
On Windows, InitGoogleTest() also works with wide strings, so it can be used in programs compiled in UNICODE mode as well.
But maybe you think that writing all those main functions is too much work? We agree with you completely, and that’s why Google Test provides a basic implementation of main(). If it fits your needs, then just link your test with the gtest_main library and you are good to go.
NOTE: ParseGUnitFlags() is deprecated in favor of InitGoogleTest().
Known Limitations
Google Test is designed to be thread-safe. The implementation is thread-safe on systems where the pthreads library is available. It is currently unsafe to use Google Test assertions from two threads concurrently on other systems (e.g. Windows). In most tests this is not an issue as usually the assertions are done in the main thread. If you want to help, you can volunteer to implement the necessary synchronization primitives in gtest-port.h for your platform.
Advanced googletest Topics
TODO
- http://google.github.io/googletest/advanced.html
Q&A
Setup/TearDown/SetUpTestCase/TearDownTestCase 的区别
Can you test SetUp success/failure in Google Test
If you put your fixture setup code into a SetUp method, and it fails and issues a fatal failure (ASSERT_XXX or FAIL macros), Google Test will not run your test body. So all you have to write is
class MyTestCase : public testing::Test {
 protected:
  bool InitMyTestData() { ... }

  virtual void SetUp() {
    ASSERT_TRUE(InitMyTestData());
  }
};

TEST_F(MyTestCase, Foo) { ... }
More: Checking for Failures in the Current Test
doctest
doctest is a new C++ testing framework but is by far the fastest both in compile times (by orders of magnitude) and runtime compared to other feature-rich alternatives. It brings the ability of compiled languages such as D, Rust, Nim to have tests written directly in the production code thanks to a fast, transparent and flexible test runner with a clean interface.
特性
doctest has been designed from the start to be as light and unintrusive as possible.
Unintrusive (transparent)
- everything testing-related can be removed from the binary executable by defining the
DOCTEST_CONFIG_DISABLEidentifier - very small and easy to integrate - single header
- Extremely low footprint on compile times - around 25ms of compile time overhead for including the header in a file
- The fastest possible assertion macros - 50k asserts can compile for under 30 seconds (even under 10 sec)
- doesn’t drag any headers when included (except for in the translation unit where the library gets implemented)
- everything is in the
doctestnamespace (and the implementation details are in a nesteddetailnamespace) - all macros have prefixes - some by default have unprefixed versions as well but that is optional - see configuration
- 0 warnings even with the most aggressive flags (on all tested compilers!)
-Weverything -pedanticfor clang-Wall -Wextra -pedanticand » over 35 « other warnings not covered by these flags for GCC - see here/Wallfor MSVC (except for:C4514,C4571,C4710,C4711)
- doesn’t error on unrecognized command line options and supports prefixes for interop with client command line parsing
- can set options procedurally and not deal with passing
argc/argvfrom the command line - doesn’t leave warnings disabled after itself
配置
Benchmarks
Tutorial
Testcases
Assertions
gcov - a Test Coverage Program
Gcov Intro
gcov是什么
gcov是一个测试代码覆盖率的工具。与GCC一起使用来分析程序,以帮助创建更高效、更快的运行代码,并发现程序的未测试部分。- 是一个命令行方式的控制台程序。需要结合
lcov,gcovr等前端图形工具能实现统计数据图形化。 - 伴随
GCC发布,不需要单独下载gcov工具。配合GCC共同实现对C/C++文件的语句覆盖和分支覆盖测试。 - 与程序概要分析工具(Profiling tool,例如
gprof)一起工作,可以估计程序中哪段代码最耗时。
gcov能做什么
- 每一行代码执行的频率是多少。
- 实际执行了哪些行代码,配合测试用例达到满意的覆盖率和预期工作。
gcov创建一个sourcefile.gcov的日志文件,此文件标识源文件sourcefile.c每一行执行的次数。gcov只在使用GCC编译的代码上工作。
gcov is a tool you can use in conjunction(结合) with GCC to test code coverage in your programs.
gcov is a test coverage program. Use it in concert with GCC to analyze your programs to help create more efficient, faster running code and to discover untested parts of your program. You can use gcov as a profiling tool to help discover where your optimization efforts will best affect your code. You can also use gcov along with the other profiling tool, gprof, to assess which parts of your code use the greatest amount of computing time.
Profiling tools help you analyze your code’s performance. Using a profiler such as gcov or gprof, you can find out some basic performance statistics, such as:
- how often each line of code executes
- what lines of code are actually executed
- how much computing time each section of code uses
Once you know these things about how your code works when compiled, you can look at each module to see which modules should be optimized. gcov helps you determine where to work on optimization.
Software developers also use coverage testing in concert with testsuites, to make sure software is actually good enough for a release. Testsuites can verify that a program works as expected; a coverage program tests to see how much of the program is exercised by the testsuite. Developers can then determine what kinds of test cases need to be added to the testsuites to create both better testing and a better final product.
You should compile your code without optimization if you plan to use gcov because the optimization, by combining some lines of code into one function, may not give you as much information as you need to look for ‘hot spots’ where the code is using a great deal of computer time. Likewise, because gcov accumulates statistics by line (at the lowest resolution), it works best with a programming style that places only one statement on each line. If you use complicated macros that expand to loops or to other control structures, the statistics are less helpful—they only report on the line where the macro call appears. If your complex macros behave like functions, you can replace them with inline functions to solve this problem.
gcov creates a logfile called sourcefile.gcov which indicates how many times each line of a source file sourcefile.c has executed. You can use these logfiles along with gprof to aid in fine-tuning the performance of your programs. gprof gives timing information you can use along with the information you get from gcov.
gcov works only on code compiled with GCC. It is not compatible with any other profiling or test coverage mechanism.
# ubuntu
sudo apt-get install -y gcovr
Procedure
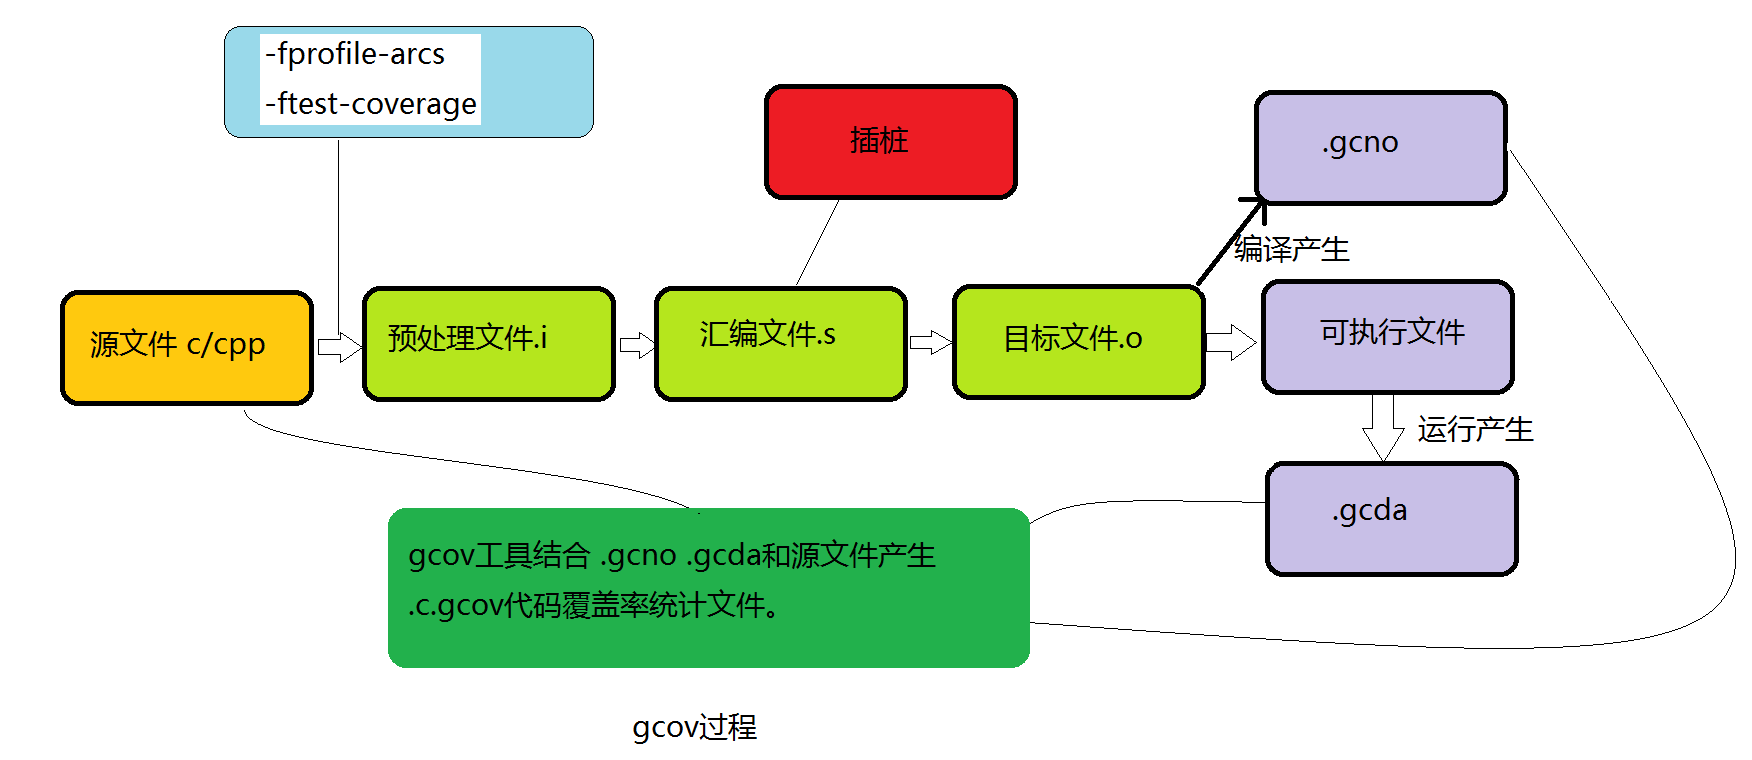
- 编译前,在编译器中加入
-fprofile-arcs和-ftest-coverage编译参数 - 源码文件(
.c/.cc)经过编译预处理,再编译生成汇编文件(.s),在生成汇编文件的同时完成插桩 - 执行可执行文件,在运行过程中之前插入桩点负责收集程序的执行信息。所谓桩点,其实就是一个变量,内存中的一个格子,对应的代码执行一次,则其值增加一次
- 生成
.gcda文件,其中有执行统计次数等,由此经过加工可得到覆盖率
PS:
-ftest-coveragetells gcc to dump the notes file for each source file as SOURCE.gcno-fprofile-arcsthe flag to instrument the code, basically adding a 64-bit counter in each basic-block.gcno包含了代码计数器和源码的映射关系 (编译时生成).gcda记录了每段代码具体的执行次数(执行时生成)
Invoking gcov
gcov [options] files
refer: https://gcc.gnu.org/onlinedocs/gcc/Invoking-Gcov.html#Invoking-Gcov
gcov should be run with the current directory the same as that when you invoked the compiler. Otherwise it will not be able to locate the source files. gcov produces files called mangledname.gcov in the current directory. These contain the coverage information of the source file they correspond to. One .gcov file is produced for each source (or header) file containing code, which was compiled to produce the data files. The mangledname part of the output file name is usually simply the source file name, but can be something more complicated if the ‘-l’ or ‘-p’ options are given. Refer to those options for details.
If you invoke gcov with multiple input files, the contributions from each input file are summed. Typically you would invoke it with the same list of files as the final link of your executable.
The .gcov files contain the ‘:’ separated fields along with program source code. The format is
execution_count:line_number:source line text
Additional block information may succeed each line, when requested by command line option. The execution_count is ‘-’ for lines containing no code. Unexecuted lines are marked ‘#####’ or ‘=====’, depending on whether they are reachable by non-exceptional paths or only exceptional paths such as C++ exception handlers, respectively. Given the ‘-a’ option, unexecuted blocks are marked ‘$’ or ‘%%%%%’, depending on whether a basic block is reachable via non-exceptional or exceptional paths. Executed basic blocks having a statement with zero execution_count end with ‘*’ character and are colored with magenta color with the -k option. This functionality is not supported in Ada.
Note that GCC can completely remove the bodies of functions that are not needed – for instance if they are inlined everywhere. Such functions are marked with ‘-’, which can be confusing. Use the -fkeep-inline-functions and -fkeep-static-functions options to retain these functions and allow gcov to properly show their execution_count.
Some lines of information at the start have line_number of zero. These preamble lines are of the form
-:0:tag:value
The ordering and number of these preamble lines will be augmented as gcov development progresses — do not rely on them remaining unchanged. Use tag to locate a particular preamble line.
The additional block information is of the form
tag information
The information is human readable, but designed to be simple enough for machine parsing too.
When printing percentages, 0% and 100% are only printed when the values are exactly 0% and 100% respectively. Other values which would conventionally be rounded to 0% or 100% are instead printed as the nearest non-boundary value.
When using gcov, you must first compile your program with a special GCC option ‘–coverage’. This tells the compiler to generate additional information needed by gcov (basically a flow graph of the program) and also includes additional code in the object files for generating the extra profiling information needed by gcov. These additional files are placed in the directory where the object file is located.
Running the program will cause profile output to be generated. For each source file compiled with -fprofile-arcs, an accompanying .gcda file will be placed in the object file directory.
Running gcov with your program’s source file names as arguments will now produce a listing of the code along with frequency of execution for each line. For example, if your program is called tmp.cpp, this is what you see when you use the basic gcov facility:
$ g++ --coverage tmp.cpp -c
$ g++ --coverage tmp.o
$ a.out
$ gcov tmp.cpp -m
File 'tmp.cpp'
Lines executed:92.86% of 14
Creating 'tmp.cpp.gcov'
The file tmp.cpp.gcov contains output from gcov. Here is a sample:
        -:    0:Source:tmp.cpp
        -:    0:Working directory:/home/gcc/testcase
        -:    0:Graph:tmp.gcno
        -:    0:Data:tmp.gcda
        -:    0:Runs:1
        -:    0:Programs:1
        -:    1:#include <stdio.h>
        -:    2:
        -:    3:template<class T>
        -:    4:class Foo
        -:    5:{
        -:    6:  public:
       1*:    7:  Foo(): b (1000) {}
------------------
Foo<char>::Foo():
    #####:    7:  Foo(): b (1000) {}
------------------
Foo<int>::Foo():
        1:    7:  Foo(): b (1000) {}
------------------
       2*:    8:  void inc () { b++; }
------------------
Foo<char>::inc():
    #####:    8:  void inc () { b++; }
------------------
Foo<int>::inc():
        2:    8:  void inc () { b++; }
------------------
        -:    9:
        -:   10:  private:
        -:   11:  int b;
        -:   12:};
        -:   13:
        -:   14:template class Foo<int>;
        -:   15:template class Foo<char>;
        -:   16:
        -:   17:int
        1:   18:main (void)
        -:   19:{
        -:   20:  int i, total;
        1:   21:  Foo<int> counter;
        -:   22:
        1:   23:  counter.inc();
        1:   24:  counter.inc();
        1:   25:  total = 0;
        -:   26:
       11:   27:  for (i = 0; i < 10; i++)
       10:   28:    total += i;
        -:   29:
       1*:   30:  int v = total > 100 ? 1 : 2;
        -:   31:
        1:   32:  if (total != 45)
    #####:   33:    printf ("Failure\n");
        -:   34:  else
        1:   35:    printf ("Success\n");
        1:   36:  return 0;
        -:   37:}
Note that line 7 is shown in the report multiple times. First occurrence presents total number of execution of the line and the next two belong to instances of class Foo constructors. As you can also see, line 30 contains some unexecuted basic blocks and thus execution count has asterisk symbol.
When you use the -b option, your output looks like this:
        -:    0:Source:tmp.cpp
        -:    0:Working directory:/home/gcc/testcase
        -:    0:Graph:tmp.gcno
        -:    0:Data:tmp.gcda
        -:    0:Runs:1
        -:    0:Programs:1
        -:    1:#include <stdio.h>
        -:    2:
        -:    3:template<class T>
        -:    4:class Foo
        -:    5:{
        -:    6:  public:
       1*:    7:  Foo(): b (1000) {}
------------------
Foo<char>::Foo():
function Foo<char>::Foo() called 0 returned 0% blocks executed 0%
    #####:    7:  Foo(): b (1000) {}
------------------
Foo<int>::Foo():
function Foo<int>::Foo() called 1 returned 100% blocks executed 100%
        1:    7:  Foo(): b (1000) {}
------------------
       2*:    8:  void inc () { b++; }
------------------
Foo<char>::inc():
function Foo<char>::inc() called 0 returned 0% blocks executed 0%
    #####:    8:  void inc () { b++; }
------------------
Foo<int>::inc():
function Foo<int>::inc() called 2 returned 100% blocks executed 100%
        2:    8:  void inc () { b++; }
------------------
        -:    9:
        -:   10:  private:
        -:   11:  int b;
        -:   12:};
        -:   13:
        -:   14:template class Foo<int>;
        -:   15:template class Foo<char>;
        -:   16:
        -:   17:int
function main called 1 returned 100% blocks executed 81%
        1:   18:main (void)
        -:   19:{
        -:   20:  int i, total;
        1:   21:  Foo<int> counter;
call    0 returned 100%
branch  1 taken 100% (fallthrough)
branch  2 taken 0% (throw)
        -:   22:
        1:   23:  counter.inc();
call    0 returned 100%
branch  1 taken 100% (fallthrough)
branch  2 taken 0% (throw)
        1:   24:  counter.inc();
call    0 returned 100%
branch  1 taken 100% (fallthrough)
branch  2 taken 0% (throw)
        1:   25:  total = 0;
        -:   26:
       11:   27:  for (i = 0; i < 10; i++)
branch  0 taken 91% (fallthrough)
branch  1 taken 9%
       10:   28:    total += i;
        -:   29:
       1*:   30:  int v = total > 100 ? 1 : 2;
branch  0 taken 0% (fallthrough)
branch  1 taken 100%
        -:   31:
        1:   32:  if (total != 45)
branch  0 taken 0% (fallthrough)
branch  1 taken 100%
    #####:   33:    printf ("Failure\n");
call    0 never executed
branch  1 never executed
branch  2 never executed
        -:   34:  else
        1:   35:    printf ("Success\n");
call    0 returned 100%
branch  1 taken 100% (fallthrough)
branch  2 taken 0% (throw)
        1:   36:  return 0;
        -:   37:}
For each function, a line is printed showing how many times the function is called, how many times it returns and what percentage of the function’s blocks were executed.
The execution counts are cumulative. If the example program were executed again without removing the .gcda file, the count for the number of times each line in the source was executed would be added to the results of the previous run(s). This is potentially useful in several ways. For example, it could be used to accumulate data over a number of program runs as part of a test verification suite, or to provide more accurate long-term information over a large number of program runs.
The data in the .gcda files is saved immediately before the program exits. For each source file compiled with -fprofile-arcs, the profiling code first attempts to read in an existing .gcda file; if the file doesn’t match the executable (differing number of basic block counts) it will ignore the contents of the file. It then adds in the new execution counts and finally writes the data to the file.
Data File Relocation to Support Cross-Profiling
To support cross-profiling, a program compiled with -fprofile-arcs can relocate the data files based on two environment variables:
GCOV_PREFIXcontains the prefix to add to the absolute paths in the object file. Prefix can be absolute, or relative. The default is no prefix.GCOV_PREFIX_STRIPindicates the how many initial directory names to strip off the hardwired absolute paths. Default value is 0.
Note: If GCOV_PREFIX_STRIP is set without GCOV_PREFIX is undefined, then a relative path is made out of the hardwired absolute paths.
For example, if the object file /user/build/foo.o was built with -fprofile-arcs, the final executable will try to create the data file /user/build/foo.gcda when running on the target system. This will fail if the corresponding directory does not exist and it is unable to create it. This can be overcome by, for example, setting the environment as GCOV_PREFIX=/target/run and GCOV_PREFIX_STRIP=1. Such a setting will name the data file /target/run/build/foo.gcda.
You must move the data files to the expected directory tree in order to use them for profile directed optimizations (-fprofile-use), or to use the gcov tool.
refer:
- Can GCOV create .gcda file in the different directory structure?
- https://gcc.gnu.org/onlinedocs/gcc/Cross-profiling.html
- HOWTO: Dumping gcov data at runtime - simple example
Clang Source-based Code Coverage
This document explains how to use clang’s source-based code coverage feature. It’s called “source-based” because it operates on AST and preprocessor information directly. This allows it to generate very precise coverage data.
Clang ships two other code coverage implementations:
- SanitizerCoverage - A low-overhead tool meant for use alongside the various sanitizers. It can provide up to edge-level coverage.
- gcov - A GCC-compatible coverage implementation which operates on DebugInfo. This is enabled by
-ftest-coverageor--coverage.
From this point onwards “code coverage” will refer to the source-based kind.
注意:clang12 使用 gcov 链接库符号冲突问题
[turbo client] /usr/bin/ld: /usr/lib64/clang/12.0.1/lib/linux/libclang_rt.profile-x86_64.a(GCDAProfiling.c.o): in function `__gcov_fork':
[turbo client] (.text+0xd00): multiple definition of `__gcov_fork'; /usr/lib/gcc/x86_64-redhat-linux/8/libgcov.a(_gcov_fork.o):(.text+0x0): first defin
ed here
[turbo client] /usr/bin/ld: /usr/lib64/clang/12.0.1/lib/linux/libclang_rt.profile-x86_64.a(GCDAProfiling.c.o): in function `__gcov_dump':
[turbo client] (.text+0xdd0): multiple definition of `__gcov_dump'; /usr/lib/gcc/x86_64-redhat-linux/8/libgcov.a(_gcov_dump.o):(.text+0x50): first defi
ned here
[turbo client] /usr/bin/ld: /usr/lib64/clang/12.0.1/lib/linux/libclang_rt.profile-x86_64.a(GCDAProfiling.c.o): in function `__gcov_reset':
[turbo client] (.text+0xe00): multiple definition of `__gcov_reset'; /usr/lib/gcc/x86_64-redhat-linux/8/libgcov.a(_gcov_reset.o):(.text+0x100): first d
efined here
[turbo client] clang-12: error: linker command failed with exit code 1 (use -v to see invocation)
gcc 的使用方式:编译选项增加 -ftest-coverage 和 -fprofile-arcs,并增加 -lgcov 链接选项。在 clang 3.5.2 使用同样方式也没有问题,而使用 clang12 则出现下述链接错误。后在 clang12 改为只使用编译选项 --coverage,功能正常。
Q&A
Dozens of “profiling:invalid arc tag” when running code coverage in Xcode 5
Most likely this is a result of the build tools failing to merge current results into the existing .gcda coverage files. As Dave Meehan points out here, there is a brute force way of dealing with this by cleaning the product build folder, but a less hard core approach is to delete the .gcda files from targets generating them (for me, just the test target) as part of the build process. Dave includes a sample script to be included as a build phase – or, at the project root by hand:
find . -name "*.gcda" -print0 | xargs -0 rm