Linux Core Dumps
- Linux Core Dumps
- So what?
- What is a core dump?
- What is Virtual Memory?
- How much virtual memory is used?
- How to request virtual memory?
- Linux 32-bit Virtual Memory Layout
- Linux 64-bit Virtual Memory Layout
- Diving in!
- User Coredumps
- Debugging User Coredumps
- Symbols
- GDB: Querying virtual memory
- GDB Details
- User coredump ulimits
- What produces a user coredump?
- Where is the user coredump?
- What’s in a user coredump?
- systemd-coredump
- abrtd
- Read Memory in GDB
- Eye catchers
- Debugging glibc malloc
- Configure Kernel Coredumps
- Reading a Kernel Coredump
- Live Kernel Debugging
- OOM Killer
- swappiness
- Memory Leaks
- Tips
- systemd-coredump
- 自定义 coredump 生成格式
- 磁盘 IO 性能优化 dd 方案
- Breakpad 方案 (Google)
- Q&A
- Refer
Linux 中的 core dump(核心转储)是一种在程序崩溃时捕获其内存状态的技术。当一个进程异常终止时,操作系统会将该进程的内存内容保存到一个名为 core 的文件中,这个文件包含了程序终止时的内存映像 。这些信息可以用于调试和分析程序崩溃的原因。
生成 core dump 的过程通常由操作系统内核控制,并受到多种因素的限制,例如文件系统的写权限、磁盘空间是否充足等。在 Linux 系统中,可以通过设置 ulimit -c unlimited 来允许生成无限大小的core dump 文件。
core dump 文件的命名和存储位置可以通过系统配置进行自定义。例如,通过修改 /proc/sys/kernel/core_pattern 文件,可以指定 core dump 文件的目录和文件名格式。默认情况下,core dump 文件通常被保存在当前工作目录下,文件名为 core 或包含进程ID的 core.PID。
对于使用 systemd 的系统,core dump 的处理由 systemd-coredump 负责,默认情况下会将核心转储存储在 /var/lib/systemd/coredump 目录中,并记录到 systemd journal 中。用户还可以通过 coredumpctl 工具来管理和分析这些核心转储文件。
此外,Linux 还支持内核崩溃转储(Kernel Coredump),这允许在内核崩溃时捕获内核的内存状态。这通常需要配置 kdump 服务,并在内核启动参数中添加相应的选项。
总结来说,Linux 中的 core dump 机制是一种强大的工具,用于在程序崩溃时捕获和分析其内存状态,从而帮助开发者定位和修复问题。
Linux Core Dumps
So what?
- Crashes are problems!
- May be symptoms of security vulnerabilities
- May be application bugs
- Data corruption
- Memory leaks
- A hard crash kills outstanding work
- Without automatic process restarts, crashes lead to service unavailability
- With restarts, a hacker may continue trying.
- We shouldn’t be scared of core dumps.
- When a dog poops inside the house, we don’t just
rm -f $pooor let it pile up, we try to figure out why or how to avoid it again.
- When a dog poops inside the house, we don’t just
What is a core dump?
It’s just a file that contains virtual memory contents, register values, and other meta-data.
- User land core dump: Represents state of a particular process (e.g. from crash)
- Kernel core dump: Represents state of the kernel (e.g. from panic) and process data
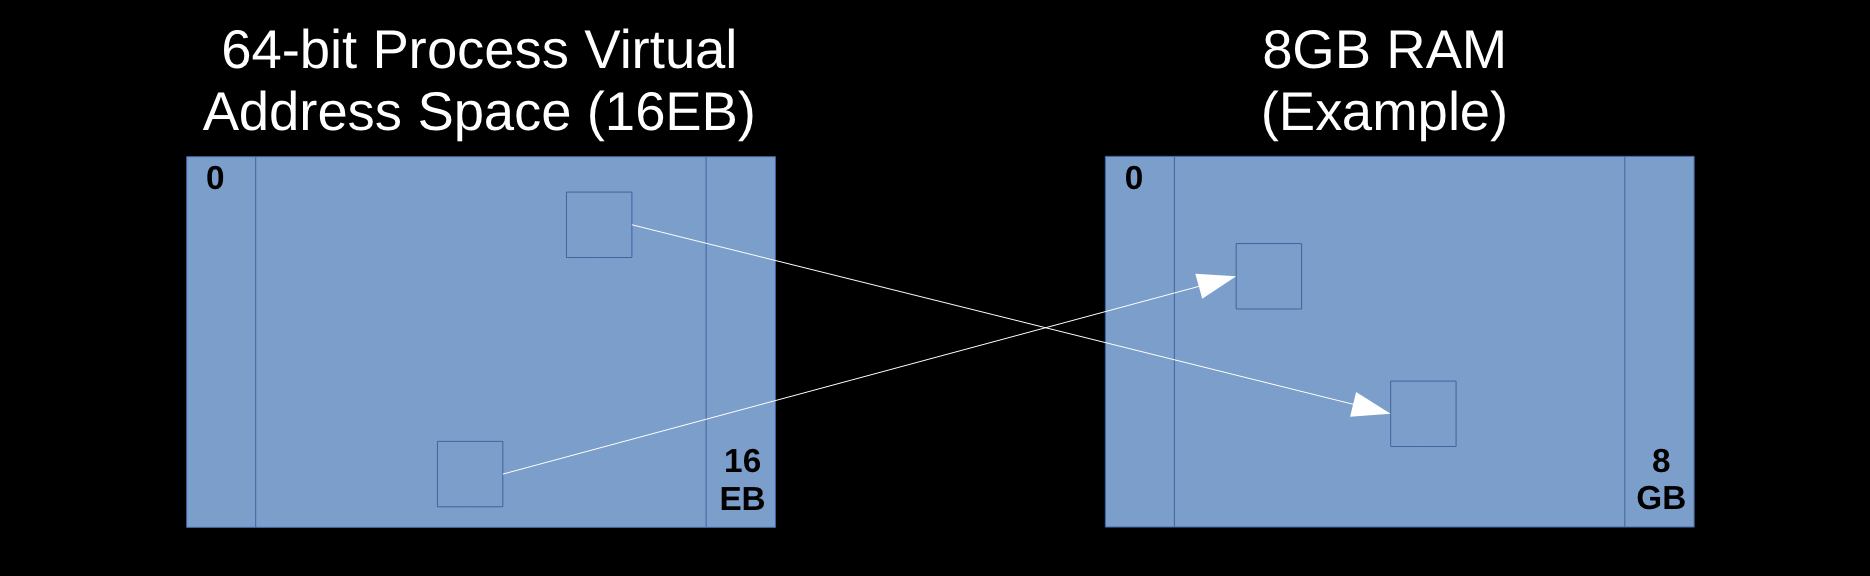
What is Virtual Memory?
- Virtual Memory is an abstraction over physical memory (RAM/swap)
- Simplifies programming
- User land: process isolation
- Kernel/processor translate virtual address references to physical memory locations
How much virtual memory is used?
Use ps or similar tools to query user process virtual memory usage (in KB):
$ ps -o pid,vsz,rss -p `pidof unittestsvr`
    PID    VSZ   RSS
1647815 2022532 564596
Virtual memory is broken up into virtual memory areas (VMAs), the sum of which equal VSZ and may be printed with:
$ cat /proc/${PID}/smaps
00400000-0040b000 r-xp 00000000 fd:02 22151273 /bin/cat
Size: 44 kB
Rss: 20 kB
Pss: 12 kB...
- The first column is the address range of the
VMA. - The second column is the set of permissions (read, write, execute, private copy on write).
- The final column is the pathname if the VMA is a file mapping. If it’s [heap], that’s the data segment (primary malloc arena).
- The
Rssvalue shows how much of theVMAis resident inRAM. - The
Pssvalue divides Rss by the total number of processes sharing thisVMA.
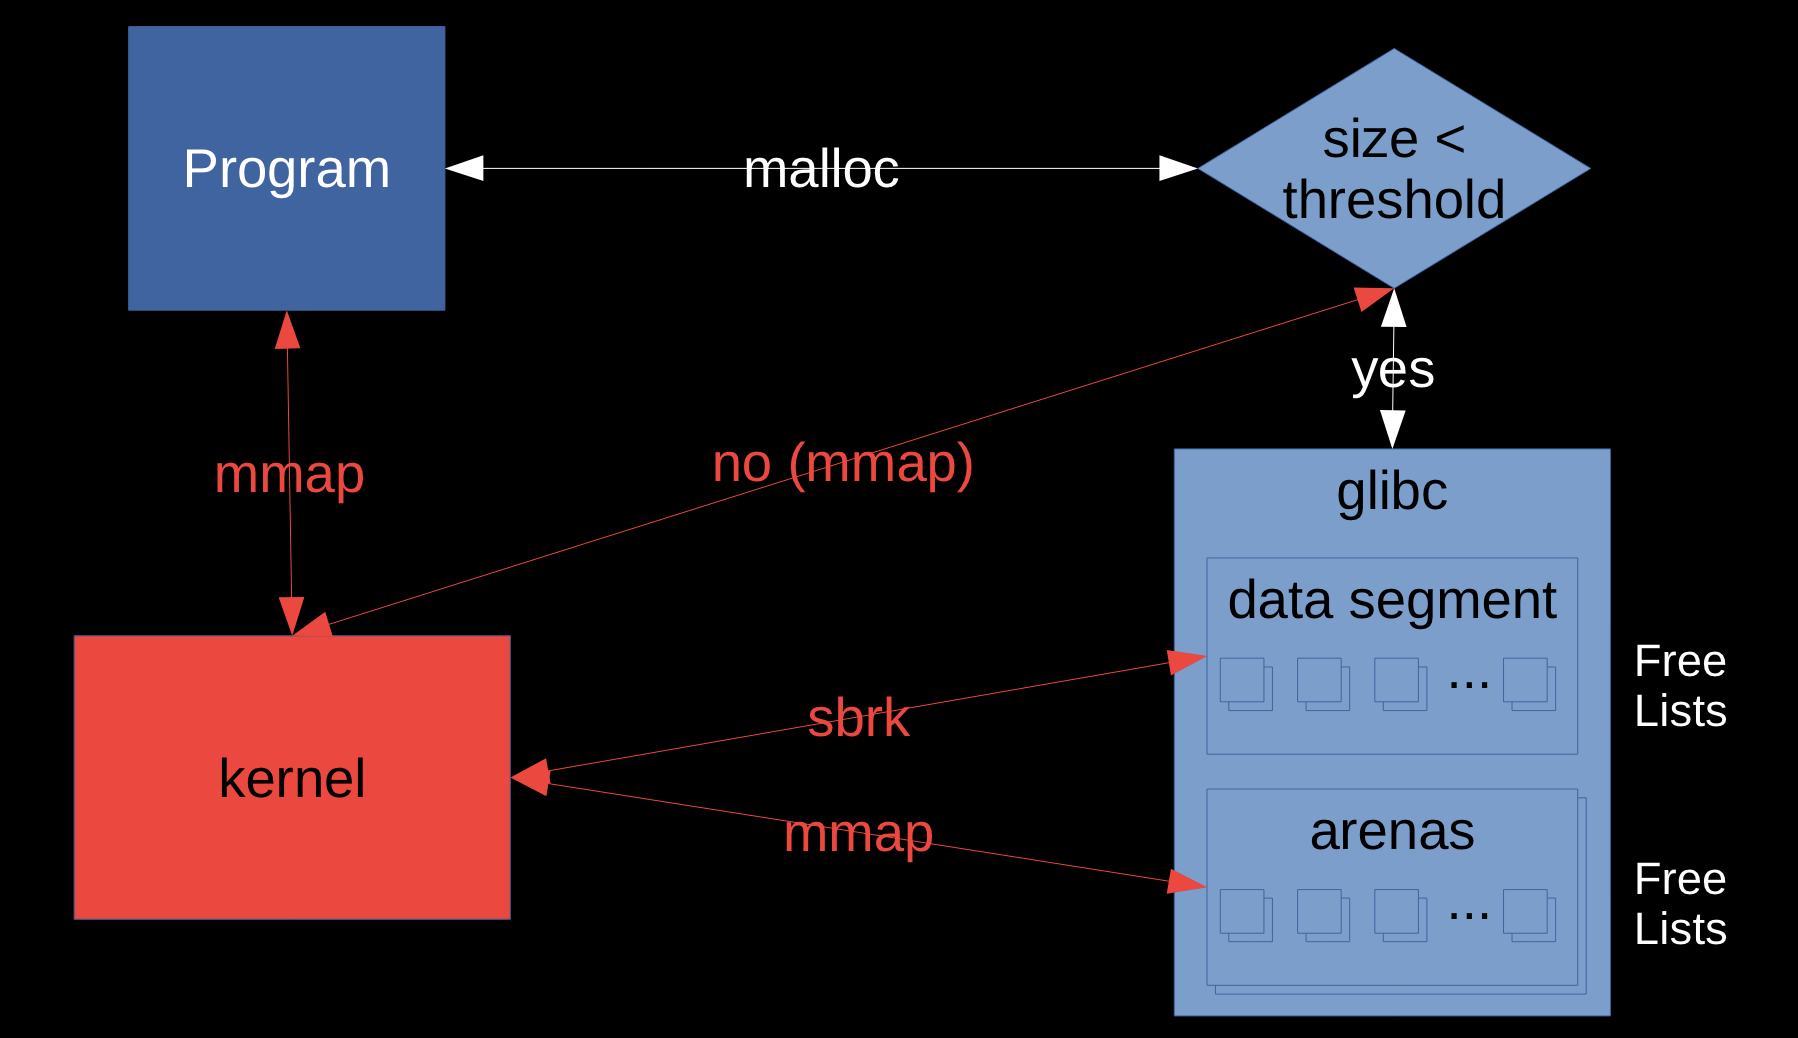
How to request virtual memory?
- malloc: request process virtual address space
- May suffer fragmentation
- mmap (syscall): size rounded up to page size and zero’d
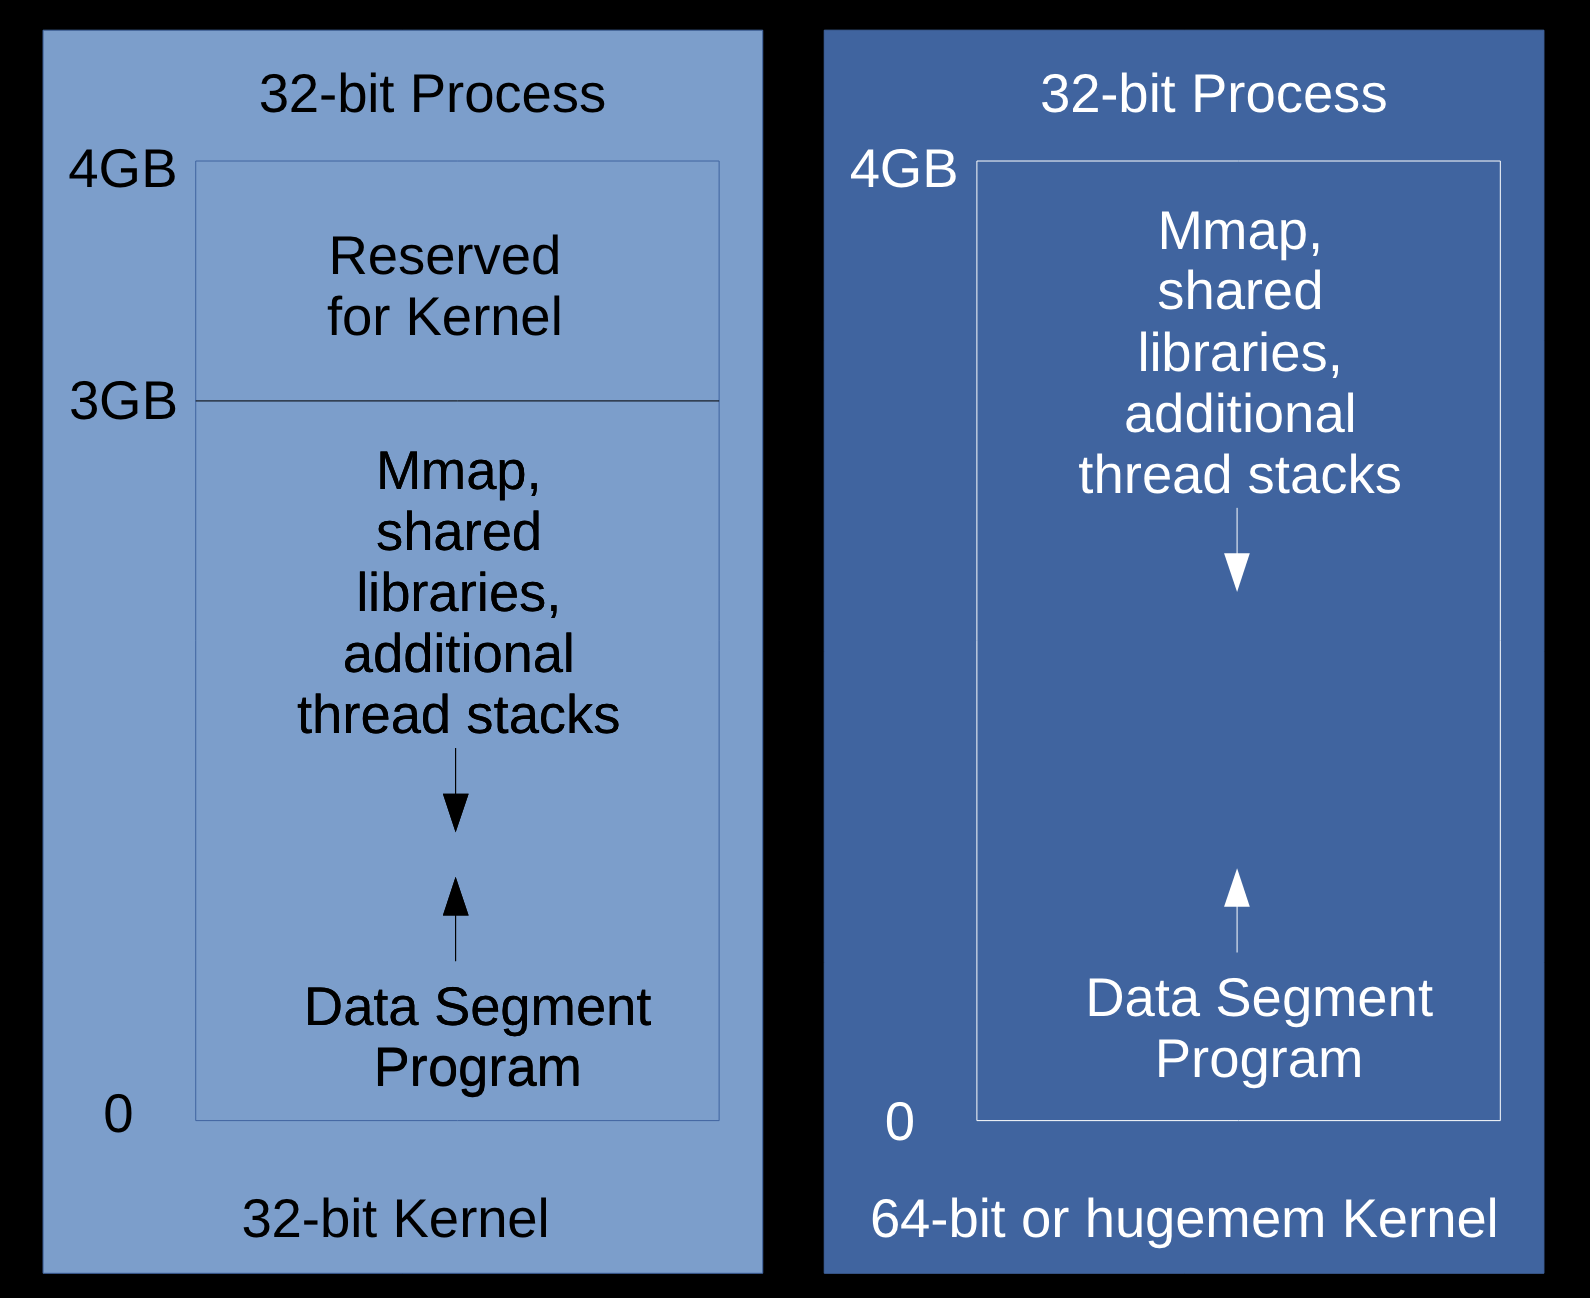
Linux 32-bit Virtual Memory Layout
- 3GB user space (2^^32), or 4GB if:
- 32-bit process on 64-bit kernel
- 32-bit hugemem kernel
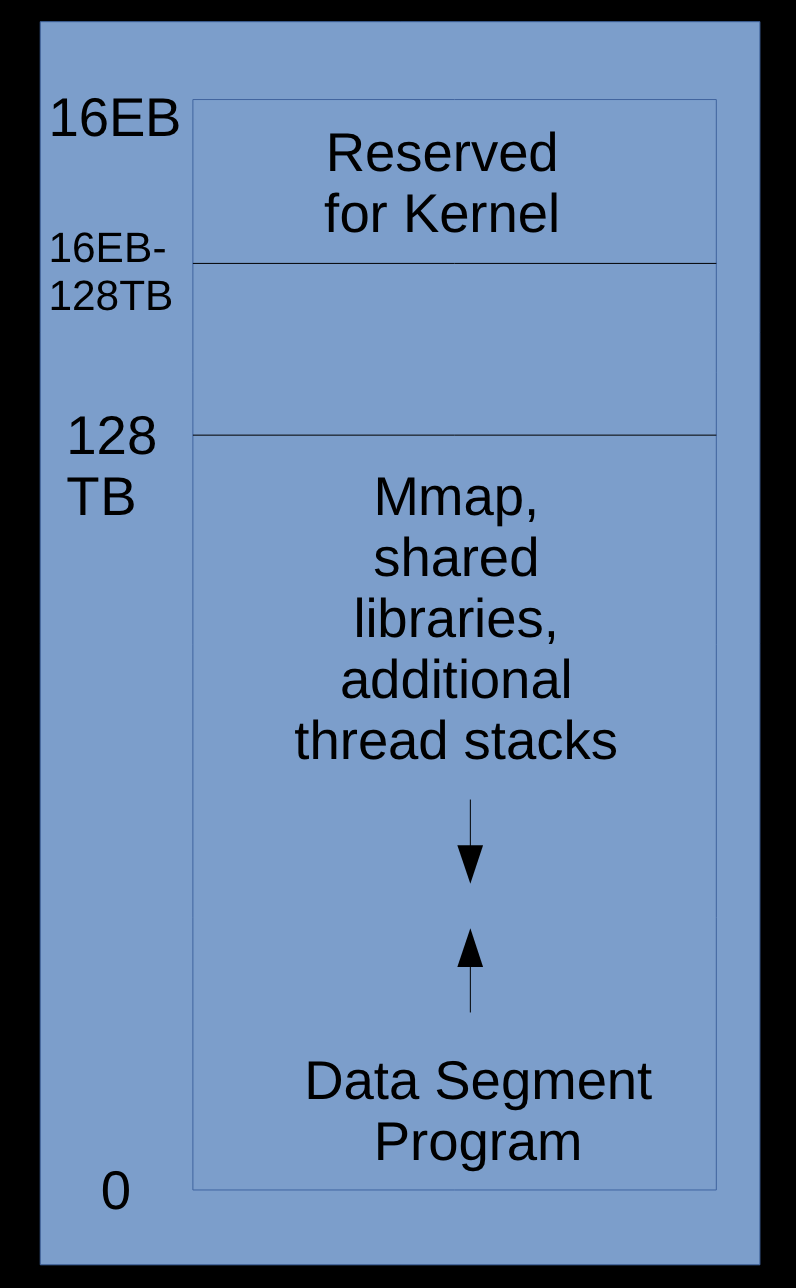
Linux 64-bit Virtual Memory Layout
- The x86_64 processor memory management unit supports up to 48-bit virtual addresses (256TB).
- https://www.kernel.org/doc/ols/2001/x86-64.pdf
128TBfor the program- 0x through 0x00007FFF’FFFFFFFF
128TBfor the kernel- 0xFFFF8000’00000000 through 0xFFFFFFFF’FFFFFFFF
$ ls -lh /proc/kcore
-r-------- 1 root root 128T Dec  3 07:06 /proc/kcore
Diving in!
- Before going through the boring details of how to produce coredumps, let’s assume we have one.
- Since it’s an ELF-formatted file, let’s see the details:
$ readelf -h core.14391.dmp
Class: ELF64
Type: CORE (Core file)...
- This confirms we’ve got a coredump from a 64-bit process.
一个完整的示例输出:
$ readelf -h core.1615592
ELF Header:
  Magic:   7f 45 4c 46 02 01 01 00 00 00 00 00 00 00 00 00
  Class:                             ELF64
  Data:                              2's complement, little endian
  Version:                           1 (current)
  OS/ABI:                            UNIX - System V
  ABI Version:                       0
  Type:                              CORE (Core file)
  Machine:                           Advanced Micro Devices X86-64
  Version:                           0x1
  Entry point address:               0x0
  Start of program headers:          64 (bytes into file)
  Start of section headers:          0 (bytes into file)
  Flags:                             0x0
  Size of this header:               64 (bytes)
  Size of program headers:           56 (bytes)
  Number of program headers:         105
  Size of section headers:           0 (bytes)
  Number of section headers:         0
  Section header string table index: 0
User Coredumps
Next, we’ll need to know which program crashed. This may be in logs, but let’s just read the notes:
# -n --notes             Display the core notes (if present)

$ readelf -n core.14391.dmp
CORE 0x000001de NT_FILE (mapped files)
Start End Page Offset
0x400000 0x401000 0x00000000 /work/toorcon/a.out …
In this case, the program is /work/toorcon/a.out
Debugging User Coredumps
Now that we know the program that produced the coredump, simply load gdb with the program and the coredump. For example:
$ gdb /work/toorcon/a.out core.14391.dmp
Program terminated with signal SIGSEGV,
Segmentation fault.
#0 0x00007f6526f1ec8a in strlen () from /lib64/libc.so.6
Missing separate debuginfos, use: debuginfo-install
glibc-2.20-8.fc21.x86_64
The (gdb) prompt awaits instructions. Type help for a list of commands. Type quit to exit.
If you’re not a developer of the program, you’ll just need to send them the coredump, libraries, and a stacktrace
(gdb) bt
– #0 0x00007f6526f1ec8a in strlen
() from /lib64/libc.so.6
#1 0x00007f6526f03d3c in puts
() from /lib64/libc.so.6
#2 0x0000000000400563 in
main (argc=1, argv=0x7ffebc36a128) at test.c:6
Even better: all stacks (打印所有线程栈信息)
(gdb) thread apply all bt
https://www.reddit.com/r/programming/comments/de3wo/stacktrace_or_gtfo/

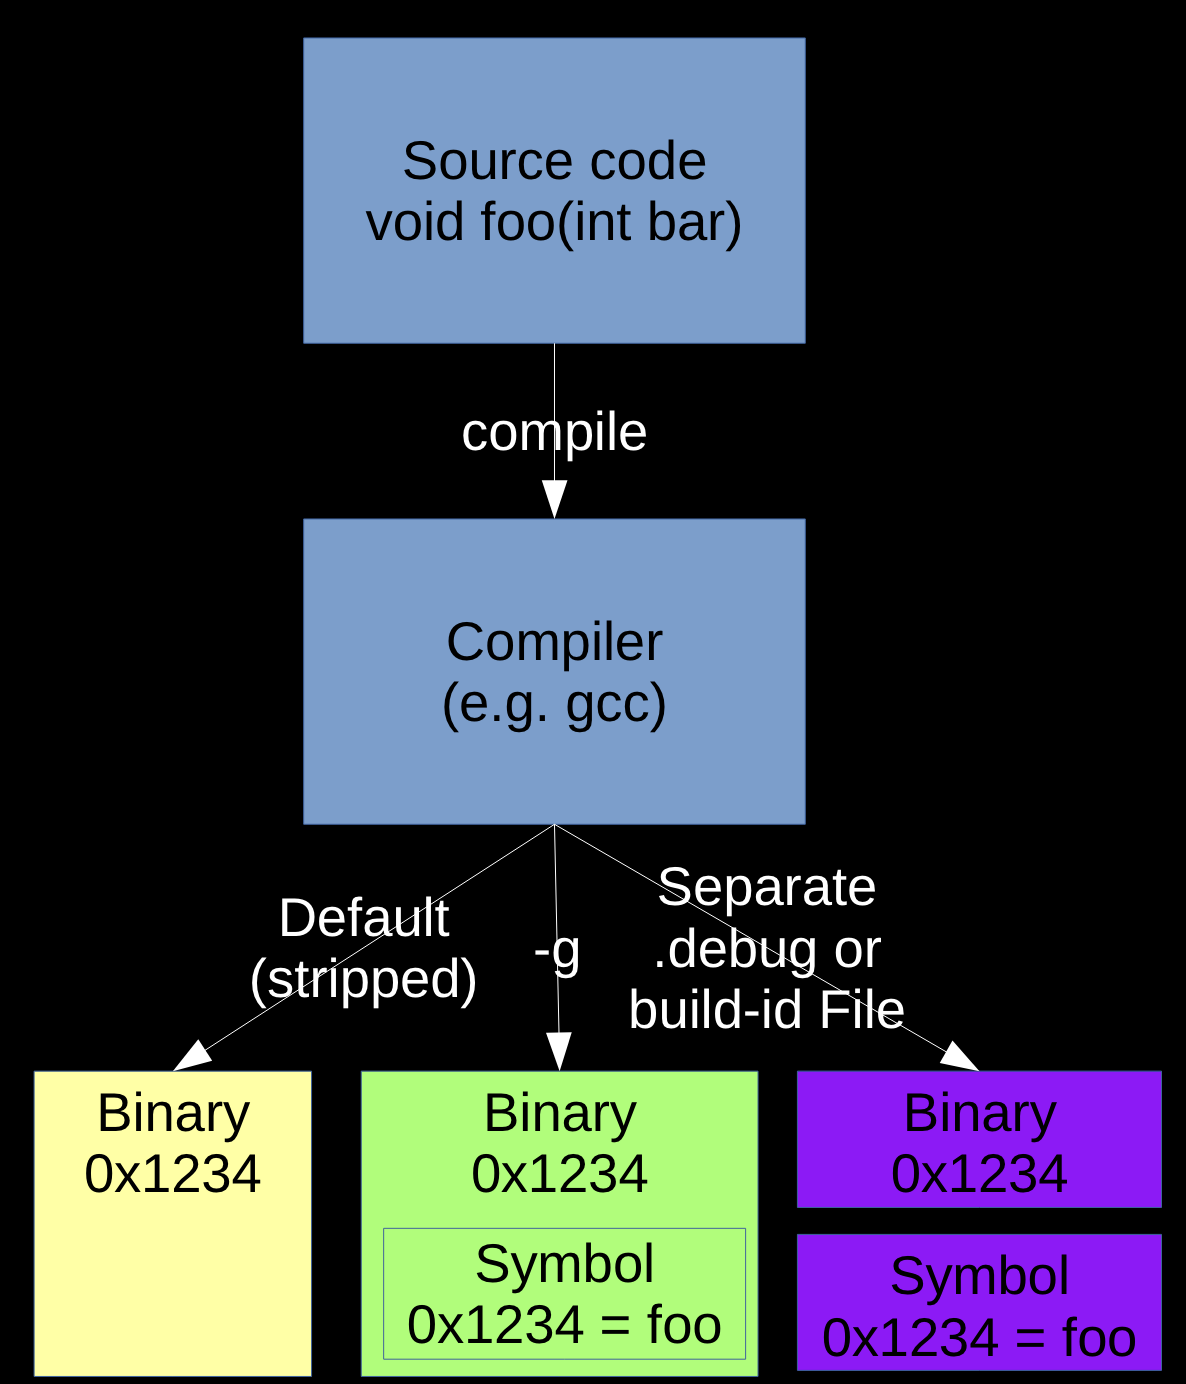
Symbols
- Symbols map virtual addresses to human-understandable names (functions, structures, etc.)
- Without symbols, you’ll just get a bunch of addresses
-gdoesn’t affect optimizations. “We recommend that you always use ‘-g’ whenever you compile a program.” https://www.sourceware.org/gdb/current/onlinedocs/gdb.html
- It’s best to load the coredump on the same machine where it was produced since gdb will find the loaded shared libraries and any installed debuginfo symbols.
- If copying the coredump for processing on another machine, also copy the program, all shared libraries in the NOTE section and expand those files into a similar folder structure and point to that:
$ gdb # no parameters
(gdb) set solib-absolute-prefix ./
(gdb) set solib-search-path .
# (gdb) set debug-file-directory ./path_to_debug
(gdb) file ./path_to_program
(gdb) core-file ./path_to_coredump
GDB: Querying virtual memory
gdb can query a core file and produce output about the virtual address space which is similar to /proc/${PID}/smaps, although it is normally a subset of all of the VMAs:
(gdb) info files
Local core dump file:
`core.16721.dmp', file type elf64-x86-64.
0x0000000000400000 - 0x0000000000401000 is load1
0x0000000000600000 - 0x0000000000601000 is load2
0x0000000000601000 - 0x0000000000602000 is load3
0x00007fe288ca5000 - 0x00007fe288ca6000 is load4a
0x00007fe288ca6000 - 0x00007fe288ca6000 is load4b
0x00007fe288e58000 - 0x00007fe288e58000 is load5...
GDB Details
Switch to a frame (list threads with info thread and switch threads with thread N):
(gdb) frame 2
#2 0x0000000000400563 in main (argc=3, argv=0x7ffd47508d18) at test.c:6
6 printf("%s\n", p);
Check why the printf crashed:
(gdb) print p
$10 = 0x0
Understand the type of argv and then print string contents:
(gdb) ptype argv
type = char **
(gdb) print argv[0]
$7 = 0x7ffd4750a17c "./a.out"
(gdb) print argv[1]
$8 = 0x7ffd4750a184 "arg1"
User coredump ulimits
- Ensure process ulimits for coredumps (
-c) and files (-f) are unlimited- The coredump ulimit (-c) often defaults to 0, suppressing cores
- A coredump is a file so the file ulimit (-f) also applies
- Ulimits may be soft or hard
- Hard: the maximum value a non-root user can set
- Soft: Sets the current limit (must be <= hard for non-root)
- Ulimits for the current shell may be queried
$ ulimit -c -f
core file size          (blocks, -c) unlimited
file size               (blocks, -f) unlimited
$ ulimit -a
core file size          (blocks, -c) unlimited
data seg size           (kbytes, -d) unlimited
scheduling priority             (-e) 0
file size               (blocks, -f) unlimited
pending signals                 (-i) 513489
max locked memory       (kbytes, -l) 64
max memory size         (kbytes, -m) unlimited
open files                      (-n) 1024
pipe size            (512 bytes, -p) 8
POSIX message queues     (bytes, -q) 819200
real-time priority              (-r) 0
stack size              (kbytes, -s) 8192
cpu time               (seconds, -t) unlimited
max user processes              (-u) 513489
virtual memory          (kbytes, -v) unlimited
file locks                      (-x) unlimited
- Or by process:
$ cat /proc/`pidof unittestsvr`/limits | grep -e Limit -e core -e "Max file size"
Limit                     Soft Limit           Hard Limit           Units
Max file size             unlimited            unlimited            bytes
Max core file size        unlimited            unlimited            bytes
$ cat /proc/`pidof unittestsvr`/limits
Limit                     Soft Limit           Hard Limit           Units
Max cpu time              unlimited            unlimited            seconds
Max file size             unlimited            unlimited            bytes
Max data size             unlimited            unlimited            bytes
Max stack size            8388608              unlimited            bytes
Max core file size        unlimited            unlimited            bytes
Max resident set          unlimited            unlimited            bytes
Max processes             513489               513489               processes
Max open files            1024                 1000000              files
Max locked memory         65536                65536                bytes
Max address space         unlimited            unlimited            bytes
Max file locks            unlimited            unlimited            locks
Max pending signals       513489               513489               signals
Max msgqueue size         819200               819200               bytes
Max nice priority         0                    0
Max realtime priority     0                    0
Max realtime timeout      unlimited            unlimited            us
-
Ulimits may be set in
limits.confon a user or group basis. -
Commonly set in /etc/security/limits.conf or /etc/security/limits.d/99-cores.conf
- The following example sets file and core soft and hard ulimits to unlimited for all users
- core unlimited
- file unlimited
-
Alternatively, run the command
ulimit -c unlimited -f unlimitedin the shell that launches the program - systemd-started processes use LimitCORE/LimitFSIZE
What produces a user coredump?
When the kernel handles certain signals (man 7 signal):
- SIGQUIT (kill -3)
- SIGILL (kill -4)
- SIGABRT (kill -6)
- SIGGFPE (kill -8)
- SIGSEGV (kill -11)
- This is one of the most common causes of a crash when a program references invalid memory (e.g. NULL)
- Others: SIGBUS, SIGSYS, SIGTRAP, SIGXCPU, SIGXFSZ, SIGUNUSED
$ kill -l
 1) SIGHUP       2) SIGINT       3) SIGQUIT      4) SIGILL       5) SIGTRAP
 2) SIGABRT      7) SIGBUS       8) SIGFPE       9) SIGKILL     10) SIGUSR1
1)  SIGSEGV     12) SIGUSR2     13) SIGPIPE     14) SIGALRM     15) SIGTERM
2)  SIGSTKFLT   17) SIGCHLD     18) SIGCONT     19) SIGSTOP     20) SIGTSTP
3)  SIGTTIN     22) SIGTTOU     23) SIGURG      24) SIGXCPU     25) SIGXFSZ
4)  SIGVTALRM   27) SIGPROF     28) SIGWINCH    29) SIGIO       30) SIGPWR
5)  SIGSYS      34) SIGRTMIN    35) SIGRTMIN+1  36) SIGRTMIN+2  37) SIGRTMIN+3
6)  SIGRTMIN+4  39) SIGRTMIN+5  40) SIGRTMIN+6  41) SIGRTMIN+7  42) SIGRTMIN+8
7)  SIGRTMIN+9  44) SIGRTMIN+10 45) SIGRTMIN+11 46) SIGRTMIN+12 47) SIGRTMIN+13
8)  SIGRTMIN+14 49) SIGRTMIN+15 50) SIGRTMAX-14 51) SIGRTMAX-13 52) SIGRTMAX-12
9)  SIGRTMAX-11 54) SIGRTMAX-10 55) SIGRTMAX-9  56) SIGRTMAX-8  57) SIGRTMAX-7
10) SIGRTMAX-6  59) SIGRTMAX-5  60) SIGRTMAX-4  61) SIGRTMAX-3  62) SIGRTMAX-2
11) SIGRTMAX-1  64) SIGRTMAX
Outside the kernel: use gcore $PID (part of gdb)
- Different code than the kernel: attaches gdb and dumps memory
- Non-destructive (i.e. process continues after detach) 不影响进程可用性
Where is the user coredump?
The coredump goes to core_pattern (see man 5 core):
$ sysctl kernel.core_pattern
kernel.core_pattern = |/usr/lib/systemd/systemd-coredump %p %u %g %s %t %e
The default is core (sometimes with %p) which writes a file named core to the current directory of the PID. May include a path to use a dedicated coredump directory
# 在当前可执行目录生成 corefile
$ sysctl kernel.core_pattern
kernel.core_pattern = core
If the value starts with a |, then the coredump bytes are piped to that program.
Often specified in /etc/sysctl.conf or {/etc/sysctl.d /usr/lib/sysctl.d /run/sysctl.d}/*.conf
What’s in a user coredump?
The memory dumped is controlled with a bit mask in /proc/$PID/coredump_filter (see man 5 core)
Inherited from parent process, so you may set in the script/shell that starts the process. Example: $ echo 0x7F > /proc/self/coredump_filter
$ cat /proc/`pidof unittestsvr`/coredump_filter
00000033
 bit 0  Dump anonymous private mappings.
 bit 1  Dump anonymous shared mappings.
 bit 2  Dump file-backed private mappings.
 bit 3  Dump file-backed shared mappings.
 bit 4 (since Linux 2.6.24)
        Dump ELF headers.
 bit 5 (since Linux 2.6.28)
        Dump private huge pages.
 bit 6 (since Linux 2.6.28)
        Dump shared huge pages.
 bit 7 (since Linux 4.4)
        Dump private DAX pages.
 bit 8 (since Linux 4.4)
        Dump shared DAX pages.
- https://stackoverflow.com/questions/36523279/coredump-filter-for-all-processes
- https://man7.org/linux/man-pages/man5/core.5.html
Never dumped:
- Anything madvise’d with MADV_DONTDUMP
- Memory the process can’t read (see the
rpermission incat /proc/$PID/smaps) - Memory-mapped I/O pages such as frame buffers
systemd-coredump
systemd-coredumpis a common user coredump handler which handles coredumps- Configured in
/etc/systemd/coredump.conf - Defaults:
- Store coredumps in
/var/lib/systemd/coredump/ - Use no more than
10%of that disk’s space - Ensures cores don’t cause that disk’s free space to go below
15%
- Store coredumps in
systemd-tmpfilesmay remove old cores
$ cat /etc/systemd/coredump.conf
#  This file is part of systemd.
#
#  systemd is free software; you can redistribute it and/or modify it
#  under the terms of the GNU Lesser General Public License as published by
#  the Free Software Foundation; either version 2.1 of the License, or
#  (at your option) any later version.
#
# Entries in this file show the compile time defaults.
# You can change settings by editing this file.
# Defaults can be restored by simply deleting this file.
#
# See coredump.conf(5) for details.

[Coredump]
#Storage=external
#Compress=yes
#ProcessSizeMax=2G
#ExternalSizeMax=2G
#JournalSizeMax=767M
#MaxUse=
#KeepFree=
abrtd
- abrtd is an older user coredump handler
- Like systemd-coredump, modified core_pattern to something like:
|/usr/libexec/abrt-hook-ccpp % s % c % p % u % g % t e
- Configured in /etc/abrt/abrt.conf
- Defaults:
- DumpLocation=/var/spool/abrt/
- MaxCrashReportsSize=1000M
Read Memory in GDB
Virtual memory may be printed with the x command:
(gdb) x/32xc 0x00007f3498000000
0x7f3498000000: 32 ' ' 0 '\000' 0 '\000' 28 '\034' 54 '6' 127 '\177' 0 '\000' 0 '\000'
0x7f3498000008: 0 '\000' 0 '\000' 0 '\000' -92 '\244' 52 '4' 127 '\177' 0 '\000' 0 '\000'...
Another option is to dump memory to a file and then spawn an xxd process from within gdb to dump that file which is easier to read (install package vim-common):
(gdb) bt
#0  0x00007f1654182e7f in ?? ()
#1  0x0000000000000000 in ?? ()
(gdb) define xxd
Type commands for definition of "xxd".
End with a line saying just "end".
>dump binary memory dump.bin $arg0 $arg0+$arg1
>shell xxd dump.bin
>shell rm -f dump.bin
>end
(gdb) xxd 0x00007f1654182e7f 32
00000000: 488b 8c24 0801 0000 6448 330c 2528 0000  H..$....dH3.%(..
00000010: 0044 89c0 7519 4881 c410 0100 005b c366  .D..u.H......[.f
For large chunks, these may be dumped to a file directly:
(gdb) dump binary memory dump.bin 0x00007f1654182e7f 0x00007f1654182f7f
$ xxd dump.bin
00000000: 488b 8c24 0801 0000 6448 330c 2528 0000  H..$....dH3.%(..
00000010: 0044 89c0 7519 4881 c410 0100 005b c366  .D..u.H......[.f
00000020: 9048 8b15 d95f 1800 f7d8 6489 02eb bae8  .H..._....d.....
00000030: dd5f 0d00 662e 0f1f 8400 0000 0000 0f1f  ._..f...........
00000040: 00f3 0f1e fa85 ff78 08f7 dfe9 a102 0000  .......x........
00000050: 9048 8b05 a95f 1800 64c7 0016 0000 00b8  .H..._..d.......
00000060: ffff ffff c366 2e0f 1f84 0000 0000 0066  .....f.........f
00000070: 9090 6666 2e0f 1f84 0000 0000 000f 1f40  ..ff...........@
00000080: 0048 c7c0 0f00 0000 0f05 0f1f 8000 0000  .H..............
00000090: 00f3 0f1e fa48 81ec 4801 0000 4989 d064  .....H..H...I..d
000000a0: 488b 0425 2800 0000 4889 8424 3801 0000  H..%(...H..$8...
000000b0: 31c0 4885 f60f 8476 0100 0048 8b06 f30f  1.H....v...H....
000000c0: 6f46 0848 89e1 488d 9424 a000 0000 f30f  oF.H..H..$......
000000d0: 6f4e 18f3 0f6f 5628 f30f 6f5e 38f3 0f6f  oN...oV(..o^8..o
000000e0: 6648 4889 0424 8b86 8800 0000 f30f 6f6e  fHH..$........on
000000f0: 580f 1144 2418 f30f 6f76 68f3 0f6f 7e78  X..D$...ovh..o~x
Large VMAs often have a lot of zero’d memory. A simple trick to filter those out is to remove all zero lines:
$ xxd dump.bin | grep -v "0000 0000 0000 0000 0000 0000 0000 0000" > dump.bin.txt
Eye catchers
Well written programs put eye catchers at the start of structures to make finding problems easiers
(gdb) xxd 0xF2E010 128
00000000: 4445 4144 4641 4444 0000 0000 0000 0000 DEADFADD........
00000010: 0000 0000 0000 0000 2100 0000 0000 0000 ........!.......
00000020: 4445 4144 4641 4444 0000 0000 7b00 0000 DEADFADD....{...
00000030: 0000 0000 0000 0000 2100 0000 0000 0000 ........!.......
00000040: 4445 4144 4641 4444 0000 0000 f600 0000 DEADFADD........
00000050: 0000 0000 0000 0000 2100 0000 0000 0000 ........!.......
00000060: 4445 4144 4641 4444 0000 0000 7101 0000 DEADFADD....q...
00000070: 0000 0000 0000 0000 2100 0000 0000 0000 ........!.......
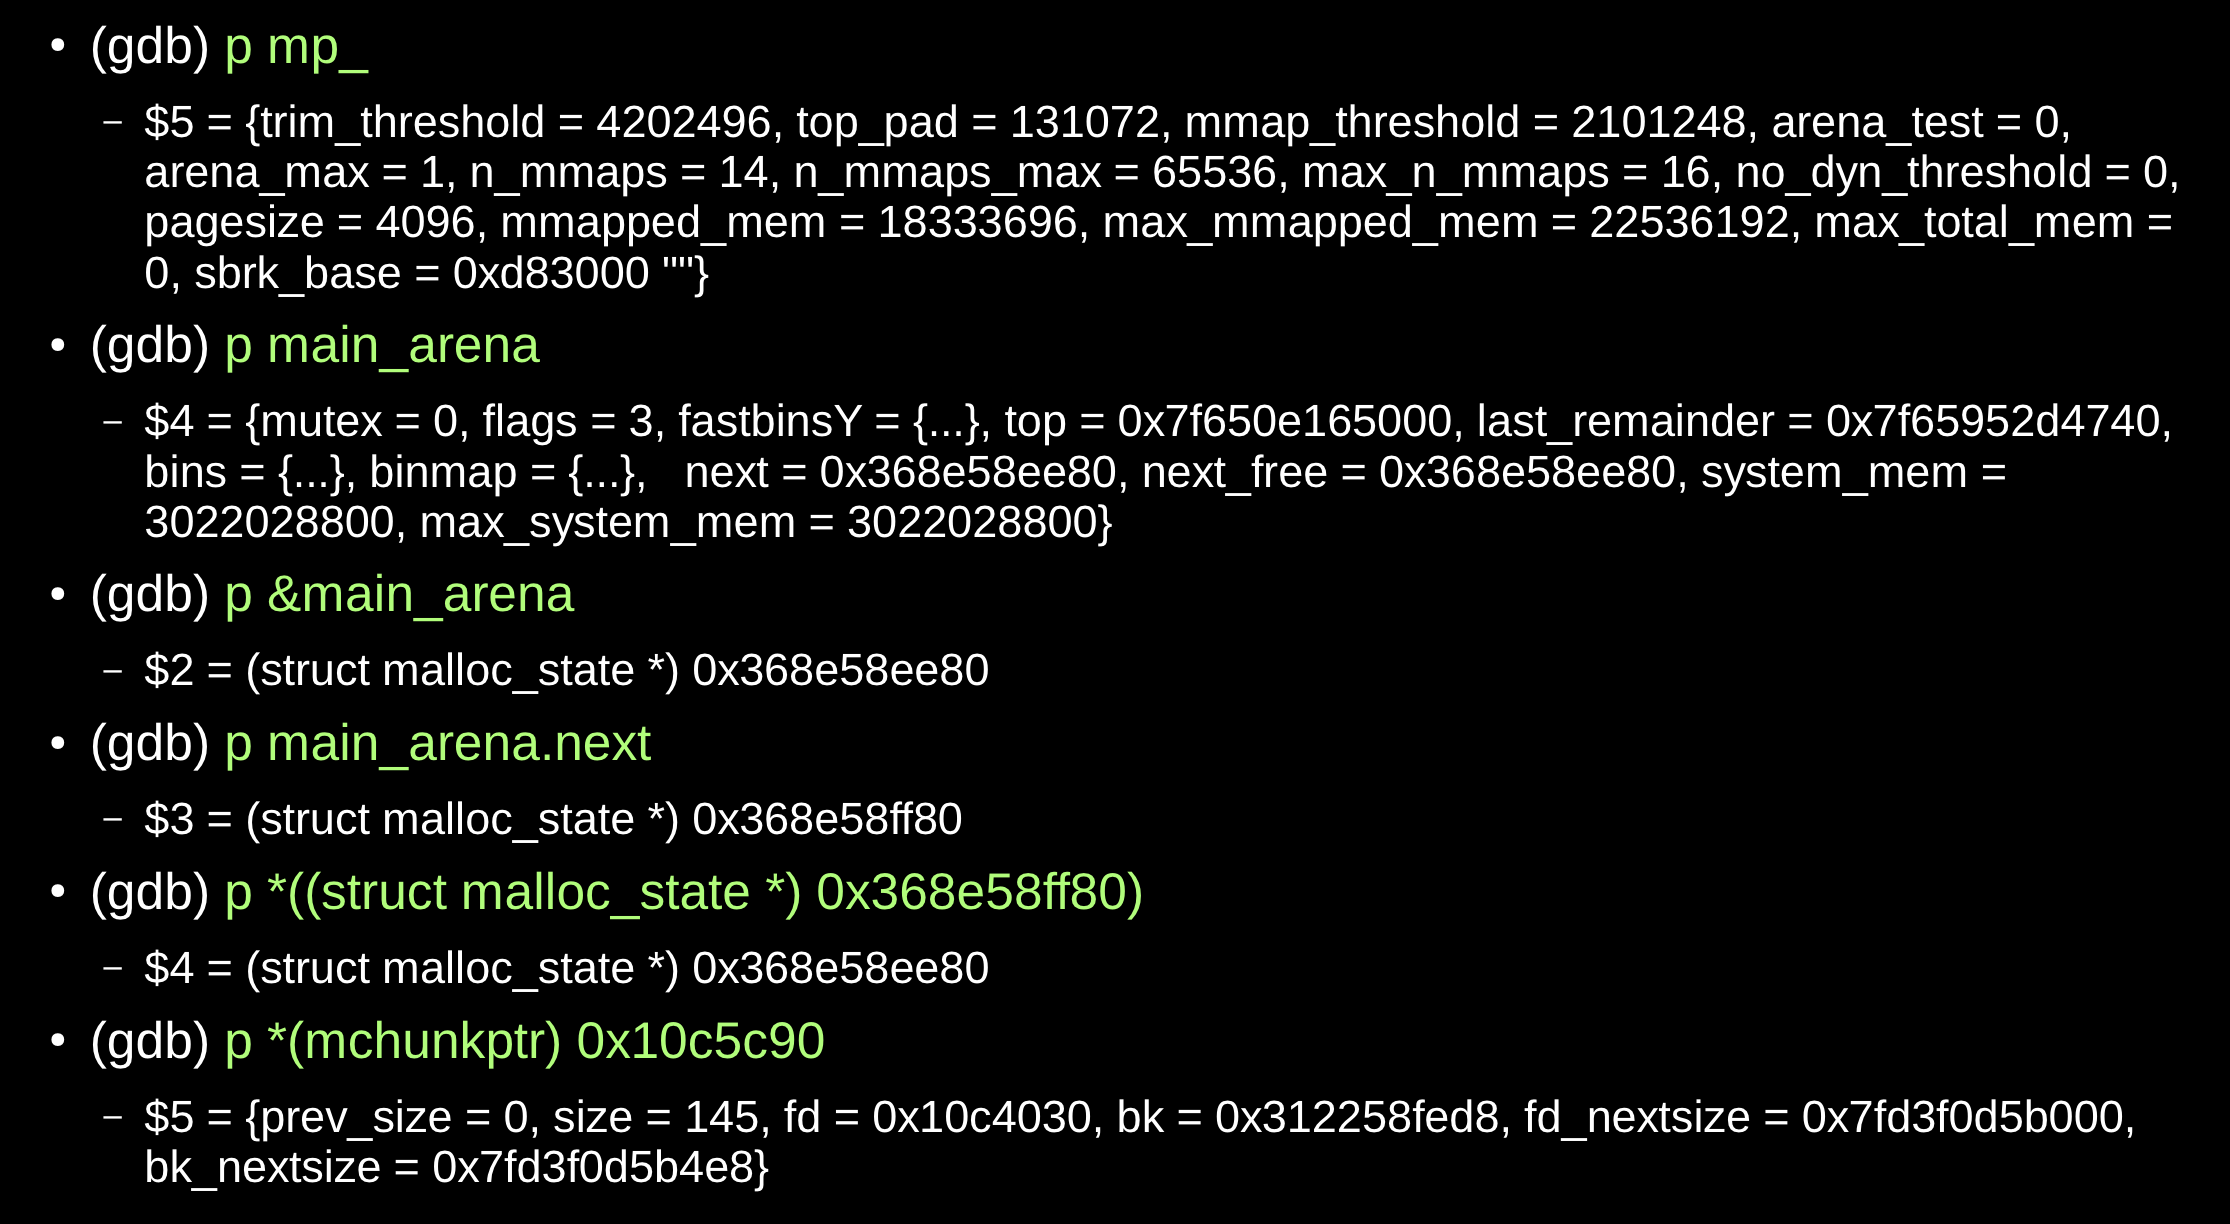
Debugging glibc malloc
Configure Kernel Coredumps
How to Create a Kernel Coredump?
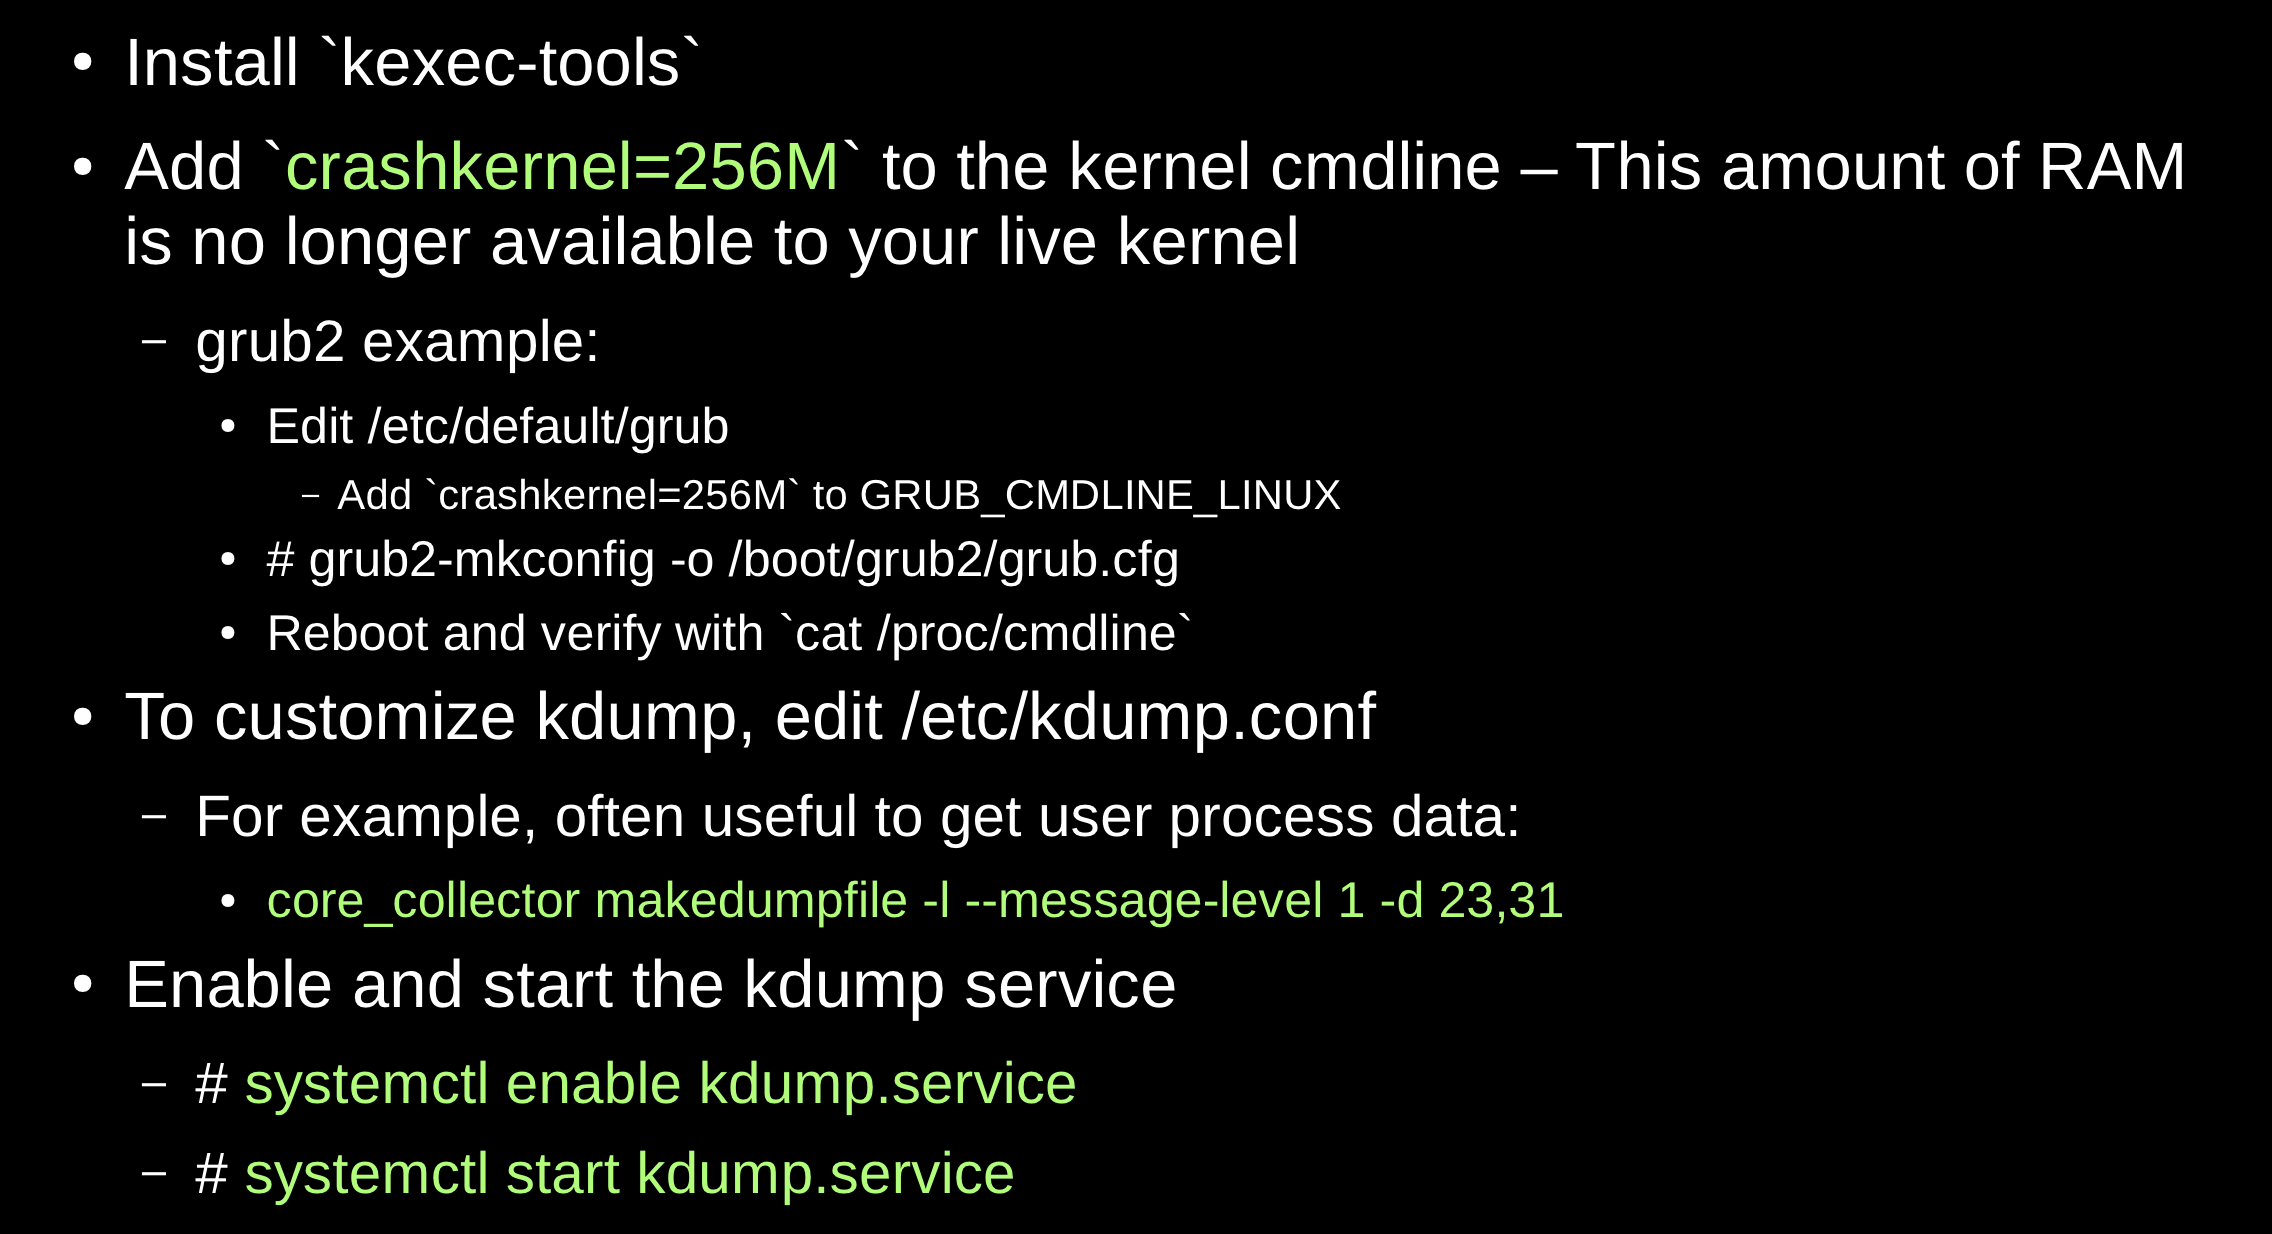
- Once the
kdumpservice is running, a kernel panic will automatically produce a kernel coredump - To manually produce a kernel coredump:
- Enable sysrq (
man 5 proc):# echo 1 > /proc/sys/kernel/sysrq - Emulate a crash:
# echo c > /proc/sysrq-trigger
- Enable sysrq (
kdumpwill dump the vmcore and reboot
Reading a Kernel Coredump
- Switch to the root user
- Kernel coredumps normally in
/var/crash/ - Install the kernel debuginfo/dbgsym packages matching the version of the vmcore
- You may install the
crashpackage, but best to compile from source: https://github.com/crash-utility/crash/releases - Run crash on the matching vmlinux file and vmcore
Live Kernel Debugging
If proper symbols are installed, simply run the crash command without arguments to debug the live kernel
OOM Killer
“By default [/proc/sys/vm/overcommit_memory=0], Linux follows an optimistic memory allocation strategy. This means that when malloc() returns non-NULL there is no guarantee that the memory really is available. In case it turns out that the system is out of memory, one or more processes will be killed by the OOM killer” (man 3 malloc).
Watch your system logs for messages such as:
kernel: Out of Memory: Killed process 123 (someprocess).
Or set /proc/sys/vm/panic_on_oom=1 to cause a kernel panic instead. Then use the bt command to see who requested memory and how much and the ps command to see what is using memory
swappiness
Linux aggressively uses physical memory for transient data such as file cache. (Linux 系统之所以积极使用物理内存作为文件缓存,是因为它可以显著提高系统性能、有效利用有限的资源,并确保系统在高负载情况下仍能正常运行)
$ free -m
total used free shared buffers cached
Mem: 15699 4573 11126 0 86 1963
-/+ buffers/cache: 2523 13176
However, /proc/sys/vm/swappiness (default 60) controls how much the kernel will prefer to page programs out rather than filecache
Set lower (e.g. 0) to avoid paging out programs
Memory Leaks
-
“Currently debugging native-memory leaks on Linux with the freely available tools is more challenging than doing the same on Windows. Whereas UMDH allows native leaks on Windows to be debugged in situ, on Linux you will probably need to do some traditional debugging rather than rely on a tool to solve the problem for you.” http://www.ibm.com/developerworks/library/j-nativememory-linux/
ltracemight help, but no stacks:$ ltrace -f -tt -p ${PID} -e malloc,free -o ltrace.outvalgrindmight work in a test environment, but not productionmtraceoverhead too high.SystemTapgood option- Find largest Rss VMAs in smaps and dump them in gdb
Tips
- Review the size of thread stacks when investigating memory usage
- If using gcore, also gather /proc/$PID/smaps beforehand
- Creating coredumps is mostly disk I/O time, so if performance is important, allocate additional RAM so that coredumps are written to filecache and written out asynchronously
- If no memory leak, but RSS increases, may be fragmentation. Consider MALLOC_MMAP_THRESHOLD_/MALLOC_MMAP_MAX_ and/or MALLOC_ARENA_MAX=1
systemd-coredump
/proc/sys/kernel/core_pattern 文件用于定义 Linux 操作系统在程序崩溃时生成 core 文件的名称和位置。它还可以用于定义一个处理程序,该处理程序在程序崩溃时被调用,用于收集和处理 core 文件。
cat /proc/sys/kernel/core_pattern
|/usr/lib/systemd/systemd-coredump %P %u %g %s %t %c %h %e
| 符号表示这是一个外部处理程序,而不是一个普通的文件名模板。在这种情况下,操作系统将调用 /usr/lib/systemd/systemd-coredump 处理程序,而不是直接将 core 文件写入磁盘。
systemd-coredump 是一个由 systemd 提供的处理程序,用于收集和处理 core 文件。当一个程序崩溃时,操作系统将调用此处理程序,并传递一些参数。这些参数包括:
%P:崩溃进程的进程 ID。
%u:崩溃进程的用户 ID。
%g:崩溃进程的组 ID。
%s:导致崩溃的信号编号。
%t:崩溃发生时的时间戳(Unix 时间)。
%c:核心文件的大小限制(ulimit)。
%h:主机名。
%e:崩溃进程的可执行文件名。
systemd-coredump 可以将 core 文件存储在文件系统中,也可以将它们存储在 systemd journal 中。此外,systemd-coredump 还可以自动压缩 core 文件,以减少存储空间占用。
要查看由 systemd-coredump 收集的 core 文件,可以使用 coredumpctl 工具。例如,要列出所有收集到的 core 文件,可以运行:
coredumpctl list
$ coredumpctl list
TIME                            PID   UID   GID SIG COREFILE  EXE
Tue 2024-01-16 15:04:27 CST  2453004 67527   100  11 missing   /usr/local/bin/clangd
Tue 2024-01-16 15:04:49 CST  3679801 67527   100  11 truncated /usr/local/bin/clangd
Tue 2024-01-16 15:49:27 CST  3739324 67527   100   6 present   /data/home/gerryyang/JLib_Run/bin/unittestsvr/unittestsvr
要获取特定 core 文件的详细信息,可以使用:
coredumpctl info <PID>
其中 <PID> 是崩溃进程的进程 ID。
$ coredumpctl info 3739324
           PID: 3739324 (unittestsvr)
           UID: 67527 (gerryyang)
           GID: 100 (users)
        Signal: 6 (ABRT)
     Timestamp: Tue 2024-01-16 15:49:26 CST (17h ago)
  Command Line: /data/home/gerryyang/JLib_Run/bin/unittestsvr/unittestsvr --id=60.59.59.1 --bus-key=3233 --svr-id-mask=7.8.8.9
    Executable: /data/home/gerryyang/JLib_Run/bin/unittestsvr/unittestsvr
 Control Group: /system.slice/sshd.service
          Unit: sshd.service
         Slice: system.slice
       Boot ID: 494e5800c825458abbffdb97b481e3e0
    Machine ID: 303d92818bb640cf87e60905bf621929
      Hostname: VM-129-173-tencentos
       Storage: /var/lib/systemd/coredump/core.unittestsvr.67527.494e5800c825458abbffdb97b481e3e0.3739324.1705391366000000.lz4
       Message: Process 3739324 (unittestsvr) of user 67527 dumped core.

                Stack trace of thread 3739324:
                #0  0x00007f27b54f6e7f raise (libc.so.6)
                #1  0x00007f27b54e18b5 abort (libc.so.6)
                #2  0x0000000001a0befb _ZN11__sanitizer5AbortEv (unittestsvr)
                #3  0x0000000001a0a888 _ZN11__sanitizer3DieEv (unittestsvr)
                #4  0x0000000001a09517 _ZN11__sanitizer18SuppressionContext13ParseFromFileEPKc (unittestsvr)
                #5  0x0000000001a1616a _ZN6__lsan22InitializeSuppressionsEv (unittestsvr)
                #6  0x00000000019fa20f AsanInitInternal (unittestsvr)
                #7  0x00007f27b6743b0e _dl_init (ld-linux-x86-64.so.2)
                #8  0x00007f27b67350ca _dl_start_user (ld-linux-x86-64.so.2)
请注意,要使用 systemd-coredump 和 coredumpctl,需要在使用 systemd 的 Linux 发行版上运行。不同的发行版可能有不同的默认配置和工具。请根据您的发行版查找适当的文档以获取更多详细信息。
systemd-coredump 处理的 coredump 文件默认存储在 /var/lib/systemd/coredump 目录中。
[root /var/lib/systemd/coredump 09:12:16]$ ls -rtlh
total 3.3G
-rw-r-----+ 1 root root 788M Jan 16 15:04 'core.clangd\x2emain.67527.494e5800c825458abbffdb97b481e3e0.3679801.1705388677000000.lz4'
-rw-r-----+ 1 root root 1.4M Jan 16 15:49  core.unittestsvr.67527.494e5800c825458abbffdb97b481e3e0.3739324.1705391366000000.lz4
如果想更改 coredump 文件的存储位置,可以编辑 /etc/systemd/coredump.conf 文件。
$ cat /etc/systemd/coredump.conf
#  This file is part of systemd.
#
#  systemd is free software; you can redistribute it and/or modify it
#  under the terms of the GNU Lesser General Public License as published by
#  the Free Software Foundation; either version 2.1 of the License, or
#  (at your option) any later version.
#
# Entries in this file show the compile time defaults.
# You can change settings by editing this file.
# Defaults can be restored by simply deleting this file.
#
# See coredump.conf(5) for details.

[Coredump]
#Storage=external
#Compress=yes
#ProcessSizeMax=2G
#ExternalSizeMax=2G
#JournalSizeMax=767M
#MaxUse=
#KeepFree=
在这个文件中,可以设置 Storage 选项为 external,并通过 ExternalLocation 选项指定一个新的存储目录。例如:
[Coredump]
Storage=external
ExternalLocation=/path/to/your/directory
更改配置后,需要重启 systemd 服务以使更改生效:
sudo systemctl daemon-reload
请注意,需要确保新的存储目录存在并具有适当的权限,以便 systemd-coredump 可以在其中创建和写入文件。
自定义 coredump 生成格式
ulimit -c unlimited

# 自定义路径格式
echo "/data/corefile/core_uid%u_%e_%t" > /proc/sys/kernel/core_pattern
echo "1" > /proc/sys/kernel/core_uses_pid

# 默认当前执行目录
echo "core" > /proc/sys/kernel/core_pattern
磁盘 IO 性能优化 dd 方案
之前某项目组 ds 产生 core 的时候,机器因为 IO 被卡住了 10s(不限服务进程)。因为底层母机上对虚拟机的 IO 限制,当 coredump 产生时直接产生了大量的写,pagecache 中大量的脏页由虚拟机的系统触发回写,导致虚拟机大量 IO 刷盘时整个虚拟机的 IO 都被卡住了。
当时的规避方案:通过将 coredump 落盘转为通过 pipe 交给其它程序处理,例如:通过 dd 来将 core 直接通过 direct_io 写,这样 dd 直接操作磁盘被母机限制,但是虚拟机系统的 pagecache 不会触发 flush 导致整个虚拟机受到影响。
echo "|/usr/bin/dd bs=1M of=/data/corefile/core_%e_%t.%p oflag=direct,noatime" > /proc/sys/kernel/core_pattern
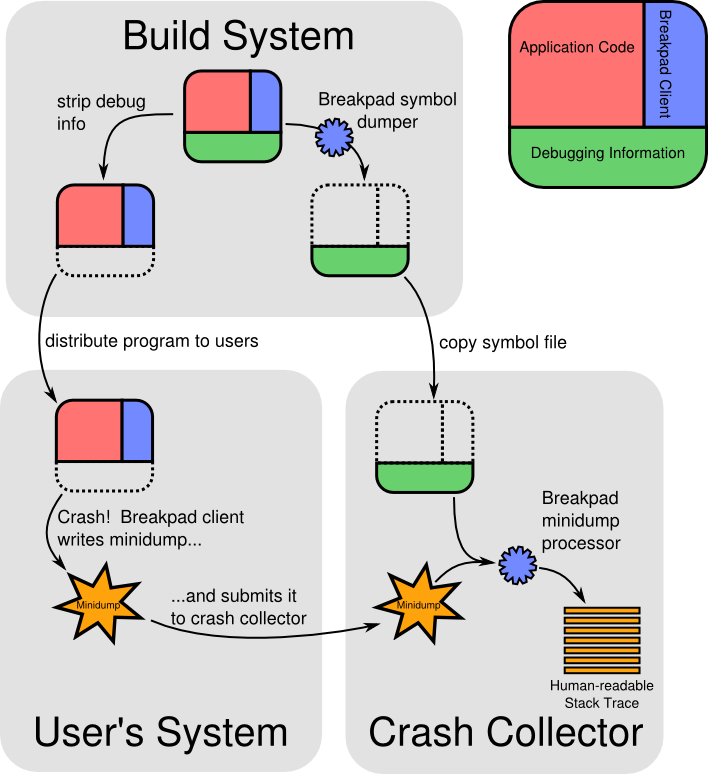
Breakpad 方案 (Google)
- https://github.com/google/breakpad?tab=readme-ov-file
- https://chromium.googlesource.com/breakpad/breakpad
Q&A
Minimal core dump (stack trace + current frame only)
https://stackoverflow.com/questions/8836459/minimal-core-dump-stack-trace-current-frame-only
Selective core dump in Linux - How can I select the dumped sections?
https://stackoverflow.com/questions/4817867/selective-core-dump-in-linux-how-can-i-select-the-dumped-sections/4818523#4818523
Refer
- https://man7.org/linux/man-pages/man5/core.5.html
- Linux Core Dumps