gperftools in Action
- HEAP PROFILER
- HEAP CHECKER
- CPU PROFILER
- Q&A
- heap.prof.0001.heap 文件的生成规则
- pprof 在生成 svg 文件时输出 addr2line: DWARF error: could not find variable specification at offset xxx
- pprof 在生成 svg 文件时输出 Dropping nodes with <= 0.5 MB; edges with <= 0.1 abs(MB)
- pprof 在生成 svg 文件时输出 Dropping nodes with <= 247 samples; edges with <= 49 abs(samples)
- gperf 输出 heap.prof.0001.heap 文件的内容含义
- EVERYTHING IN ONE (同时支持CPU和Heap分析)
- ENVIRONMENT VARIABLES (环境变量)
- PERFORMANCE
- PROFILE: interrupts/evictions/bytes = 0/0/64 (没有输出profile文件)
- 64-BIT LINUX Issue (死锁问题)
- heapcheck not work correctly
- Refer
gperftools (originally Google Performance Tools)
The fastest malloc we’ve seen; works particularly well with threads and STL. Also: thread-friendly heap-checker, heap-profiler, and cpu-profiler.
- wiki介绍:https://github.com/gperftools/gperftools/wiki
- 下载地址:https://github.com/gperftools/gperftools/releases/tag/gperftools-2.9.1
- 安装说明:https://github.com/gperftools/gperftools/blob/master/INSTALL
- API用法: 参考
gperftools/profiler.h - 安装依赖
- yum install graphviz
- yum install ghostscript (安装 ps2pdf)
- yum install kcachegrind
- http://kcachegrind.sourceforge.net/html/Download.html
- brew install qcachegrind (MacOS)
- https://stackoverflow.com/questions/4473185/need-kcachegrind-like-profiling-tools-for-mac
HEAP PROFILER
See docs/heapprofile.html for information about how to use tcmalloc’s heap profiler and analyze its output.
- Link your executable with
-ltcmalloc - Run your executable with the
HEAPPROFILEenvironment var set:HEAPPROFILE=/tmp/heapprof <path/to/binary> [binary args] - Run
pprofto analyze the heap usage
$ pprof --text <path/to/binary> heapprof.0045.heap
You can also use LD_PRELOAD to heap-profile an executable that you didn’t compile.
测试代码:
#include <iostream>
using namespace std;

void f1() {
        int i;
        for (i = 0; i < 1024* 1024; ++i) {
                short* p = new short;
                //delete p;
        }
}

void f2()  {
        int i;
        for (i = 0; i < 1024 * 1024; ++i) {
                int* p = new int;
                //delete p;
        }
}

int main() {
        f1();
        f2();
        return 0;
}
编译及内存使用分析:
$ g++ c.cc -L$HOME/tools/gperftools-2.9.1_install/lib -ltcmalloc -lprofiler
$ HEAPPROFILE=heapprofile.out ./a.out
Starting tracking the heap
Dumping heap profile to heapprofile.out.0001.heap (Exiting, 6 MB in use)
$ pprof --text a.out heapprofile.out.0001.heap
Using local file a.out.
Using local file heapprofile.out.0001.heap.
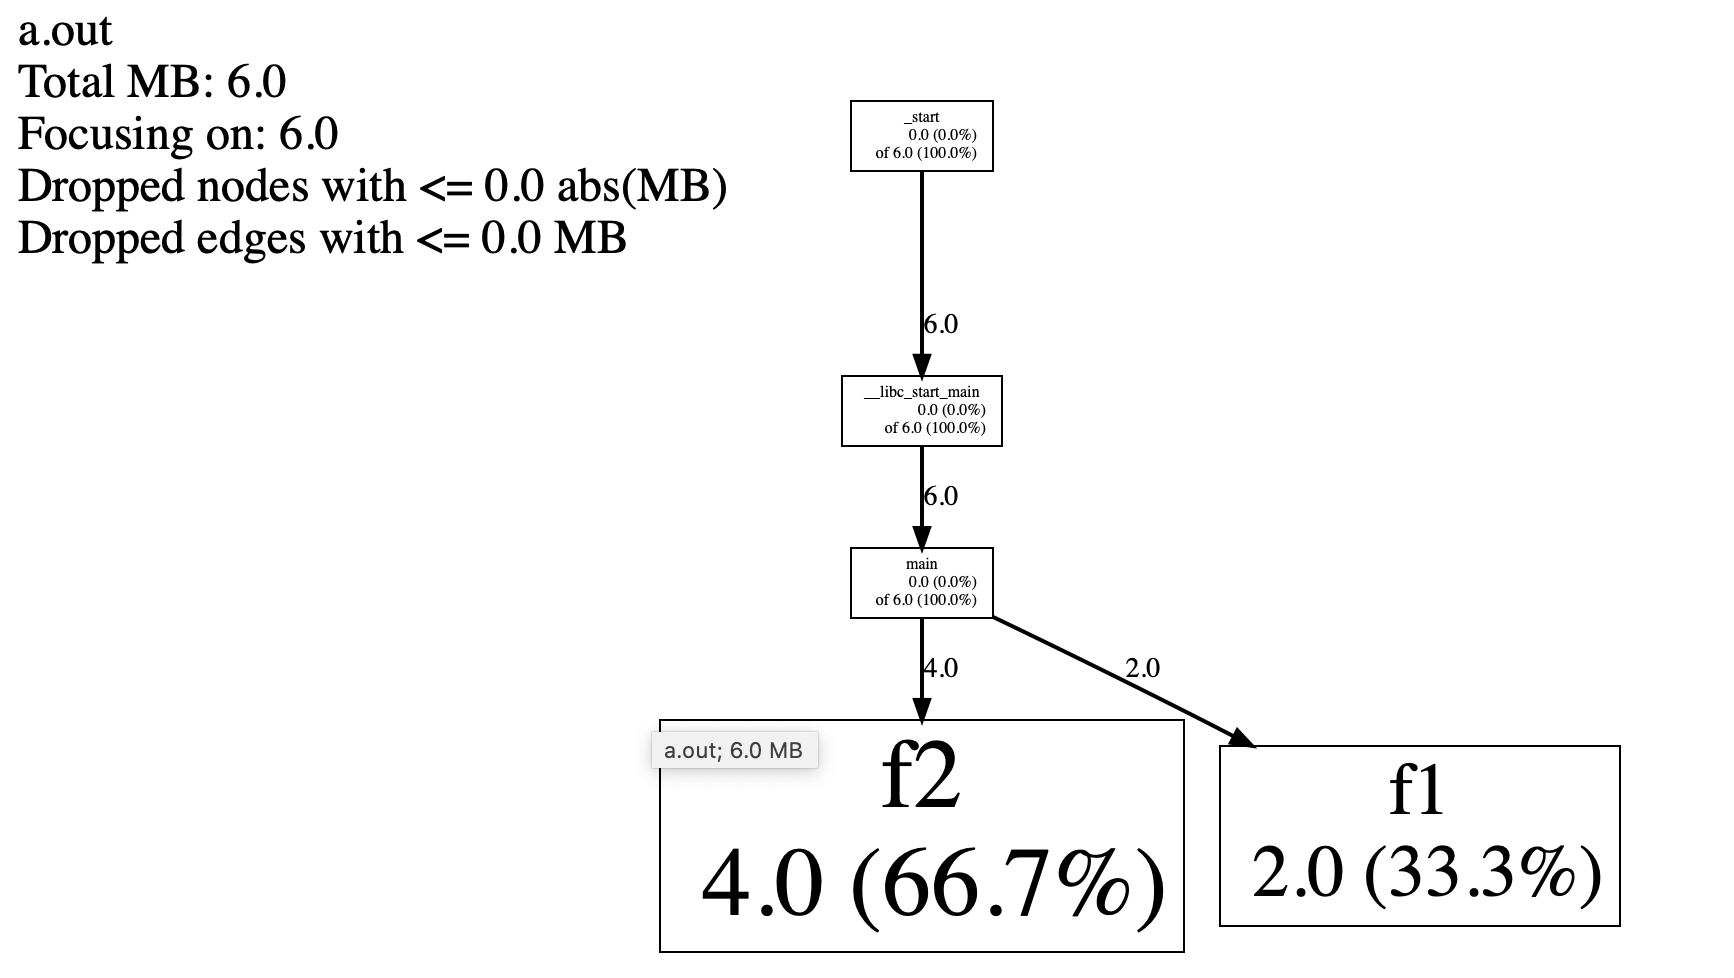
Total: 6.0 MB
4.0 66.7% 66.7% 4.0 66.7% f2
2.0 33.3% 100.0% 2.0 33.3% f1
0.0 0.0% 100.0% 6.0 100.0% __libc_start_main
0.0 0.0% 100.0% 6.0 100.0% _start
0.0 0.0% 100.0% 6.0 100.0% main
使用--svg或--pdf的方式生成调用关系图形。其中,对于CPU profile,有向边的方向表示,调用者指向被调用者;有向边上的数字表示,被调用者所消耗的CPU时间。性能分析通过抽样的方法完成(尽量减少对原程序的运行影响),默认是1秒100个样本,一个样本是10毫秒,即时间单位是10毫秒;可以通过环境变量CPUPROFILE_FREQUENCY设置采样频率。
# 输出svg
pprof --svg a.out heapprofile.out.0001.heap > heapprofile.svg

# 输出 callgrind
# http://kcachegrind.sourceforge.net/html/Home.html
pprof --callgrind a.out heapprofile.out.0001.heap > heapprofile.callgrind
查看heapprofile.svg文件:
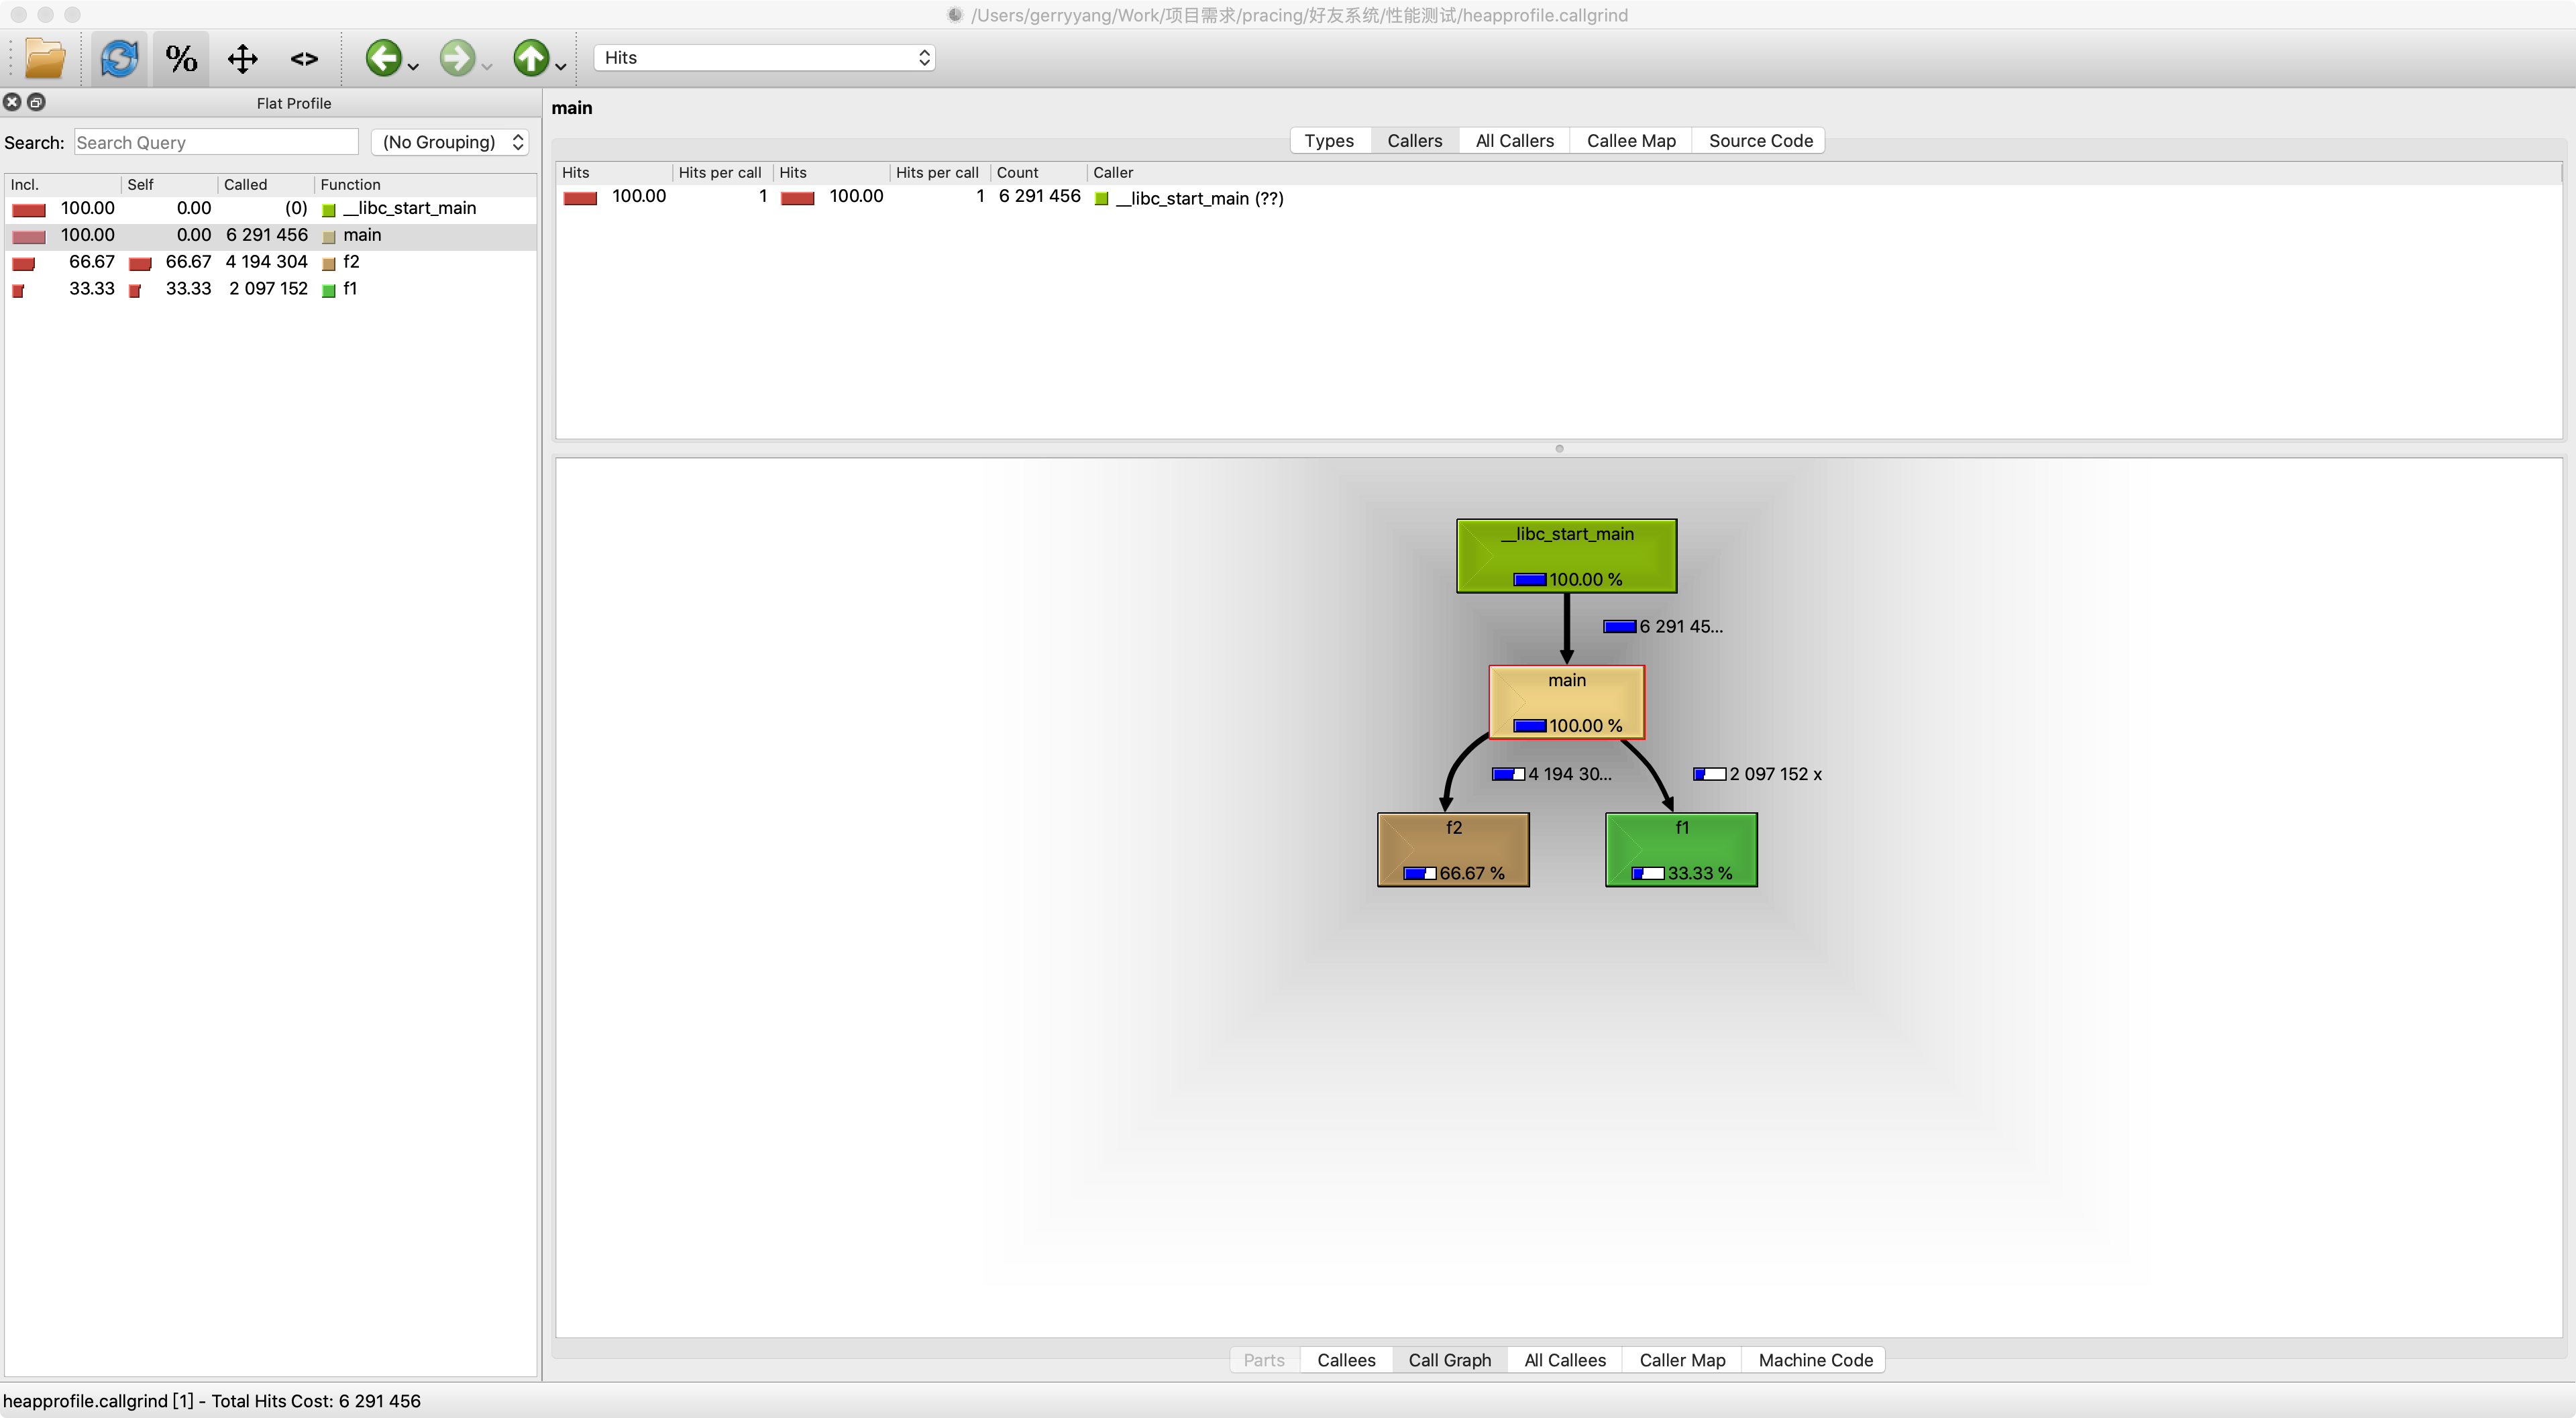
使用可视化分析工具qcachegrind打开heapprofile.callgrind查看:
计算差异数据:pprof –base=heap.prof.0001.heap –svg your_bin heap.prof.0020.heap > 1-20.diff.svg
HEAP CHECKER
See heap_checker for information about how to detect memory leaks in C++ programs.
- Linking in the Library
Link your executable with -ltcmalloc or add in the profiler at run-time using env LD_PRELOAD="/usr/lib/libtcmalloc.so"
This does not turn on heap checking; it just inserts the code. For that reason, it’s practical to just always link -ltcmalloc into a binary while developing; that’s what we do at Google. (However, since any user can turn on the profiler by setting an environment variable, it’s not necessarily recommended to install heapchecker-linked binaries into a production, running system.)
- Running the Code
Whole-program Heap Leak Checking
The recommended way to use the heap checker is in “whole program” mode. In this case, the heap-checker starts tracking memory allocations before the start of main(), and checks again at program-exit. If it finds any memory leaks – that is, any memory not pointed to by objects that are still “live” at program-exit – it aborts the program (via exit(1)) and prints a message describing how to track down the memory leak (using pprof).
The heap-checker records the stack trace for each allocation while it is active. This causes a significant increase in memory usage, in addition to slowing your program down.
Here’s how to run a program with whole-program heap checking:
Define the environment variable HEAPCHECK to the type of heap-checking to do. For instance, to heap-check /usr/local/bin/my_binary_compiled_with_tcmalloc:
env HEAPCHECK=normal /usr/local/bin/my_binary_compiled_with_tcmalloc
Note that since the heap-checker uses the heap-profiling framework internally, it is not possible to run both the heap-checker and heap profiler at the same time.
These are the legal values when running a whole-program heap check:
- minimal
- normal
- strict
- draconian
“Normal” mode, as the name implies, is the one used most often at Google. It’s appropriate for everyday heap-checking use.
In addition, there are two other possible modes:
- as-is
- local
as-is is the most flexible mode; it allows you to specify the various knobs of the heap checker explicitly.
local activates the explicit heap-check instrumentation, but does not turn on any whole-program leak checking.
Explicit (Partial-program) Heap Leak Checking
Instead of whole-program checking, you can check certain parts of your code to verify they do not have memory leaks. This check verifies that between two parts of a program, no memory is allocated without being freed.
To use this kind of checking code, bracket the code you want checked by creating a HeapLeakChecker object at the beginning of the code segment, and call NoLeaks() at the end. These functions, and all others referred to in this file, are declared in <gperftools/heap-checker.h>.
HeapLeakChecker heap_checker("test_foo");
{
code that exercises some foo functionality;
this code should not leak memory;
}
if (!heap_checker.NoLeaks()) assert(NULL == "heap memory leak");
env HEAPCHECK=local /usr/local/bin/my_binary_compiled_with_tcmalloc
If you want to do whole-program leak checking in addition to this manual leak checking, you can run in normal or some other mode instead: they’ll run the “local” checks in addition to the whole-program check.
Disabling Heap-checking of Known Leaks
Sometimes your code has leaks that you know about and are willing to accept. You would like the heap checker to ignore them when checking your program. You can do this by bracketing the code in question with an appropriate heap-checking construct:
{
    HeapLeakChecker::Disabler disabler;
    <leaky code>
}
Tuning the Heap Checker
The heap leak checker has many options, some that trade off running time and accuracy, and others that increase the sensitivity at the risk of returning false positives. For most uses, the range covered by the heap-check flavors is enough, but in specialized cases more control can be helpful.
测试代码:
#include <iostream>
using namespace std;

void f1() {
        int i;
        for (i = 0; i < 1024* 1024; ++i) {
                short* p = new short;
                delete p;
        }
}

void f2()  {
        int i;
        for (i = 0; i < 1024 * 1024; ++i) {
                int* p = new int;
                //delete p;   // memory leak!
        }
}

int main() {
        f1();
        f2();
        return 0;
}
编译及内存泄漏分析:
$ g++ c.cc -L$HOME/tools/gperftools-2.9.1_install/lib -ltcmalloc -lprofiler
$ $ env HEAPCHECK=normal ./a.out
WARNING: Perftools heap leak checker is active -- Performance may suffer
Have memory regions w/o callers: might report false leaks
Leak check _main_ detected leaks of 4194304 bytes in 1048576 objects
The 1 largest leaks:
*** WARNING: Cannot convert addresses to symbols in output below.
*** Reason: Cannot find 'pprof' (is PPROF_PATH set correctly?)
*** If you cannot fix this, try running pprof directly.
Leak of 4194304 bytes in 1048576 objects allocated from:
        @ 4011c8
        @ 4011e3
        @ 7f876b3926a3
        @ 4010ae


If the preceding stack traces are not enough to find the leaks, try running THIS shell command:

pprof ./a.out "/tmp/a.out.154004._main_-end.heap" --inuse_objects --lines --heapcheck  --edgefraction=1e-10 --nodefraction=1e-10 --gv

If you are still puzzled about why the leaks are there, try rerunning this program with HEAP_CHECK_TEST_POINTER_ALIGNMENT=1 and/or with HEAP_CHECK_MAX_POINTER_OFFSET=-1
If the leak report occurs in a small fraction of runs, try running with TCMALLOC_MAX_FREE_QUEUE_SIZE of few hundred MB or with TCMALLOC_RECLAIM_MEMORY=false, it might help find leaks more repeata
Exiting with error code (instead of crashing) because of whole-program memory leaks
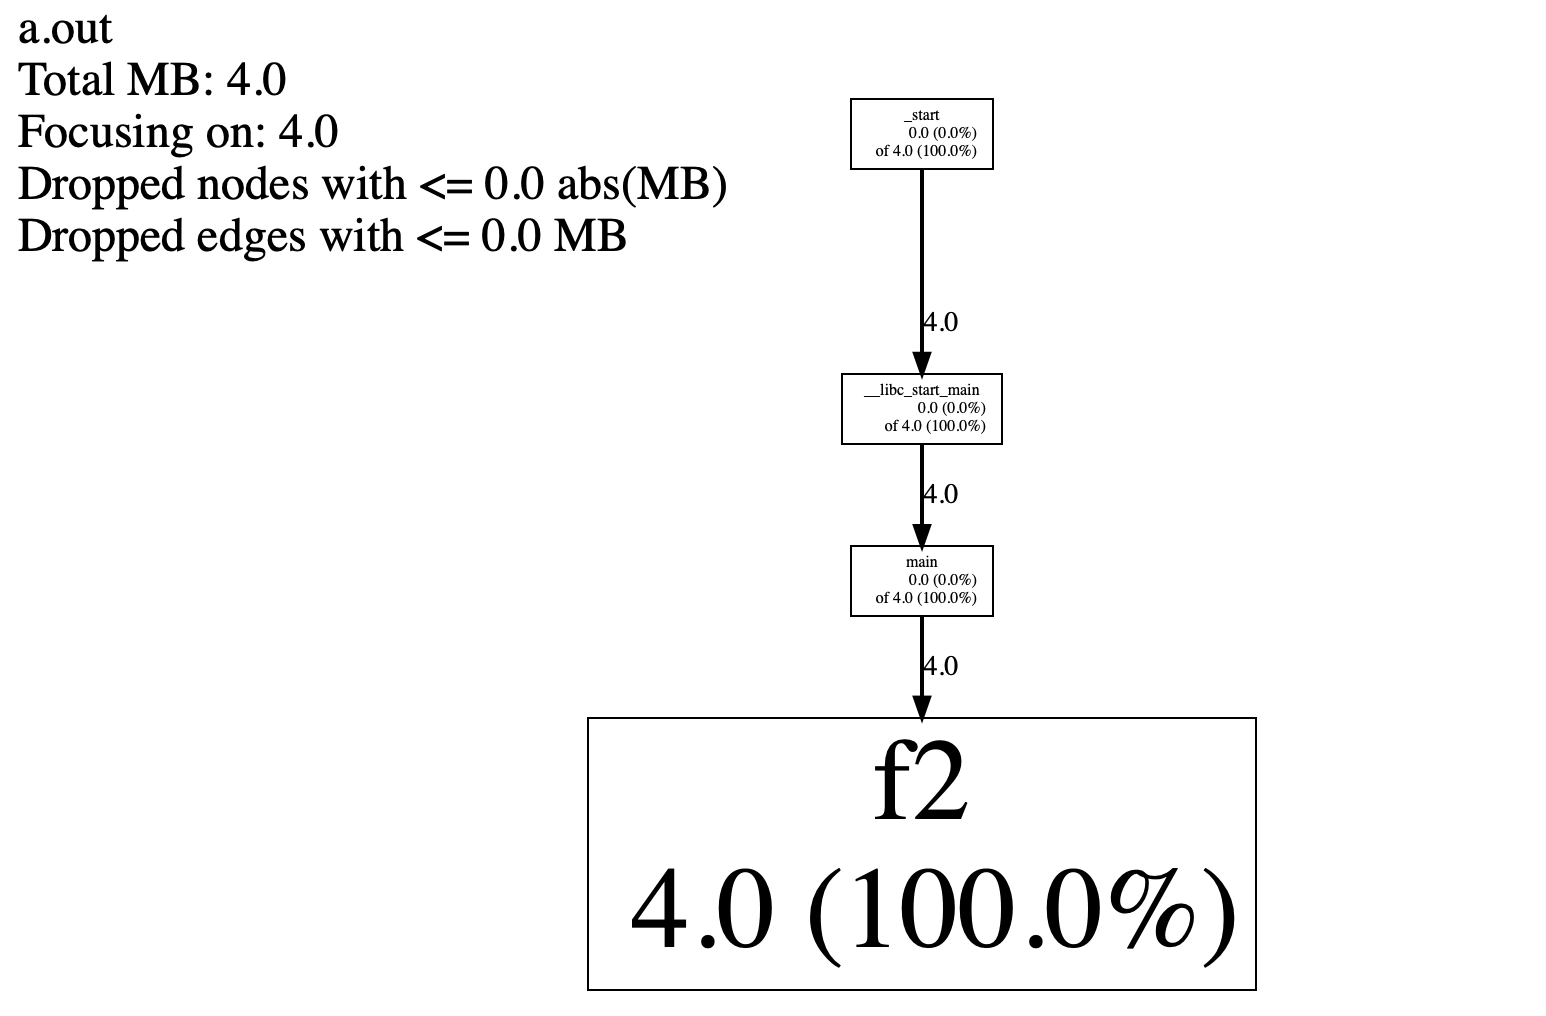
也可以生成svg格式输出,可以看到有4MB的内存泄漏:
$ pprof ./a.out "/tmp/a.out.154004._main_-end.heap" --inuse_objects --lines --heapcheck  --edgefraction=1e-10 --nodefraction=1e-10
Using local file ./a.out.
Using local file /tmp/a.out.154004._main_-end.heap.
$ pprof --svg a.out /tmp/a.out.154004._main_-end.heap > a.heap_check3.svg
Using local file a.out.
Using local file /tmp/a.out.154004._main_-end.heap.
Dropping nodes with <= 0.0 MB; edges with <= 0.0 abs(MB)
如果项目不可以链接tcmalloc,也可以通过LD_PRELOAD的方式执行:
$ g++ c.cc -L$HOME/tools/gperftools-2.9.1_install/lib
$ LD_PRELOAD="/data/home/gerryyang/tools/gperftools-2.9.1_install/lib/libtcmalloc.so" HEAPCHECK=normal ./a.out
CPU PROFILER
See docs/cpuprofile.html for information about how to use the CPU profiler and analyze its output.
- Link your executable with
-lprofiler - Run your executable with the
CPUPROFILEenvironment var set:CPUPROFILE=/tmp/prof.out <path/to/binary> [binary args] - Run pprof to analyze the CPU usage
$ pprof --text <path/to/binary> prof.out
测试代码:
#include <iostream>
using namespace std;
void func1() {
        int i = 0;
        while (i < 100000) {
                ++i;
        }
}
void func2() {
        int i = 0;
        while (i < 200000) {
                ++i;
        }
}
void func3() {
        for (int i = 0; i < 1000; ++i) {
                func1();
                func2();
        }
}
int main() {
        func3();
        return 0;
}
编译及CPU使用分析:
$ g++ a.cc -L$HOME/tools/gperftools-2.9.1_install/lib -ltcmalloc -lprofiler
$ CPUPROFILE=cpuprofile.out ./a.out
PROFILE: interrupts/evictions/bytes = 65/1/344
$ pprof --text a.out cpuprofile.out
Using local file a.out.
Using local file cpuprofile.out.
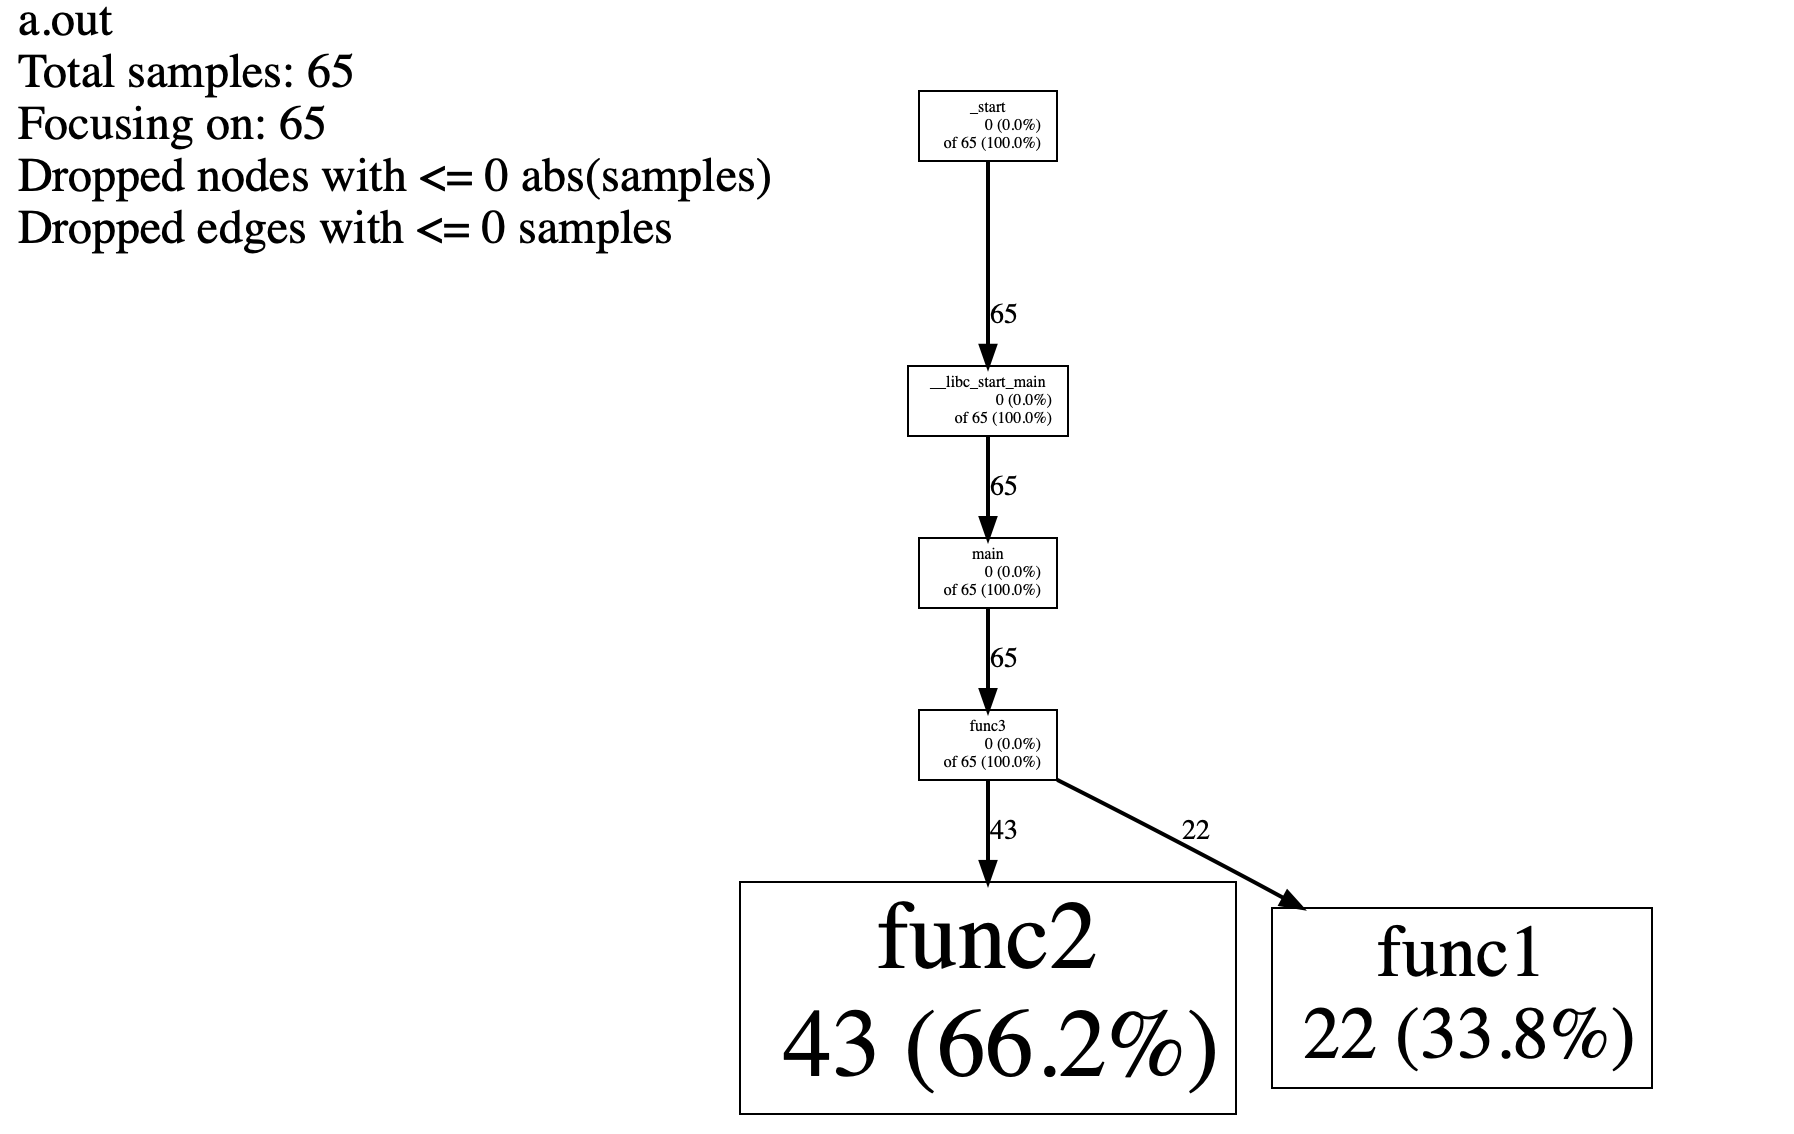
Total: 65 samples
43 66.2% 66.2% 43 66.2% func2
22 33.8% 100.0% 22 33.8% func1
0 0.0% 100.0% 65 100.0% __libc_start_main
0 0.0% 100.0% 65 100.0% _start
0 0.0% 100.0% 65 100.0% func3
0 0.0% 100.0% 65 100.0% main
其他输出方式:
# 输出pdf
pprof --pdf a.out cpuprofile.out > cpuprofile.pdf

# 输出svg
pprof --svg a.out cpuprofile.out > cpuprofile.svg
Q&A
heap.prof.0001.heap 文件的生成规则
gperftools 的 heap profiler 生成的 heap.prof.* 文件是堆分配的采样文件。每个文件表示一个时间点的内存分配情况。文件名中的数字(例如 heap.prof.0001.heap 中的 0001)表示 heap profiler 生成的文件序号。序号从 0001 开始,每次生成新的采样文件时递增。
在以下情况下,heap profiler 会生成新的采样文件:
- 当分配的内存达到预先设定的阈值时。这个阈值可以通过
HEAP_PROFILE_ALLOCATION_INTERVAL环境变量设置。默认情况下,每分配 1GB 内存,heap profiler 就会生成一个新的采样文件。 - 当程序显式调用
HeapProfilerDump()函数时。这个函数允许程序在运行过程中手动触发 heap profiler 生成采样文件。这可以用于在关键点(例如程序的不同阶段或操作完成后)获取内存分配的详细信息。
多个 heap.prof.* 文件表示程序在不同时间点的内存分配情况。通过比较这些文件,可以了解程序在运行过程中内存分配的变化情况,从而找到可能的内存泄漏或者优化程序的内存使用。
例如,如果在 heap.prof.0001.heap 文件中看到一个大量内存分配,而在 heap.prof.0002.heap 文件中看到相同的内存分配仍然存在且没有显著减少,那么这可能意味着程序在这段时间内没有正确地释放内存。这可以帮助找到程序中的内存泄漏或其他内存管理问题。
pprof 在生成 svg 文件时输出 addr2line: DWARF error: could not find variable specification at offset xxx
这个错误表明 addr2line 在尝试解析程序的 DWARF 调试信息时遇到了问题。DWARF 是一种用于在可执行文件中存储源代码和行号信息的调试格式。pprof 使用 addr2line 工具来将堆栈跟踪中的内存地址转换为源代码中的文件名和行号。
pprof 在生成 svg 文件时输出 Dropping nodes with <= 0.5 MB; edges with <= 0.1 abs(MB)
这个消息来自于 pprof,它在生成内存分析报告时,为了简化图形的复杂性,会自动过滤掉一些较小的内存分配。
具体来说,pprof 会过滤掉以下两类信息:
-
“Dropping nodes with <= 0.5 MB”:这表示 pprof 过滤掉了那些内存分配总量小于或等于 0.5 MB 的节点。这里的 “节点” 指的是堆栈跟踪中的一个函数。如果一个函数分配的内存总量小于或等于 0.5 MB,那么这个函数在 pprof 的报告中就不会出现。
-
“Dropping edges with <= 0.1 abs(MB)”:这表示 pprof 过滤掉了那些内存分配总量小于或等于 0.1 MB 的边。这里的 “边” 指的是堆栈跟踪中的一个函数调用。如果一个函数调用分配的内存总量小于或等于 0.1 MB,那么这个函数调用在 pprof 的报告中就不会出现。
这两个过滤条件可以帮助 pprof 减少报告的复杂性,让你更容易关注那些分配了大量内存的函数和函数调用。如果你希望看到所有的内存分配,你可以在运行 pprof 时使用 --nodecount 和 --edgecount 选项来调整这两个过滤条件。例如:
pprof --svg --nodecount=10000 --edgecount=10000 a.out heapprofile.out.0001.heap > heapprofile.svg
这个命令将会显示最多 10000 个节点和边,无论它们分配了多少内存。
pprof 在生成 svg 文件时输出 Dropping nodes with <= 247 samples; edges with <= 49 abs(samples)
这个消息来自于 pprof,它在生成性能分析报告时,为了简化图形的复杂性,会自动过滤掉一些较少的采样。
具体来说,pprof 会过滤掉以下两类信息:
-
“Dropping nodes with <= 247 samples”:这表示 pprof 过滤掉了那些采样数小于或等于 247 的节点。这里的 “节点” 指的是堆栈跟踪中的一个函数。如果一个函数的采样数小于或等于 247,那么这个函数在 pprof 的报告中就不会出现。
-
“Dropping edges with <= 49 abs(samples)”:这表示 pprof 过滤掉了那些采样数小于或等于 49 的边。这里的 “边” 指的是堆栈跟踪中的一个函数调用。如果一个函数调用的采样数小于或等于 49,那么这个函数调用在 pprof 的报告中就不会出现。
这两个过滤条件可以帮助 pprof 减少报告的复杂性,让你更容易关注那些采样数较多的函数和函数调用。如果你希望看到所有的采样,你可以在运行 pprof 时使用 --nodecount 和 --edgecount 选项来调整这两个过滤条件。例如:
pprof --svg --nodecount=10000 --edgecount=10000 a.out profile.out > profile.svg
这个命令将会显示最多 10000 个节点和边,无论它们的采样数是多少。
gperf 输出 heap.prof.0001.heap 文件的内容含义
heap profile: 139930: 105204024 [305381: 114365828] @ heapprofile
     1: 20367388 [     1: 20367388] @ 0x0e0eac44 0x00000000 0x00000000
     1: 10240000 [     1: 10240000] @ 0x0e0e9a27 0x00000000 0x00000000
     1:  8388744 [     1:  8388744] @ 0x08b2ebf1 0x08b300a2 0x08b42e2f 0x08b42f57 0x08b42ea7 0x086b0b11 0x086b0a2c 0x08ad5e84 0x08ad5e28 0x7f06c2d9b4aa 0x08b3008c 0x08b42e2f
     1:  8388744 [     1:  8388744] @ 0x08b2ebf1 0x08b300a2 0x08b42e2f 0x08b42f57 0x08b42ea7 0x087c6c33 0x08795a84 0x087908fe 0x08897879 0x086e514a 0x086e3c81 0x7f06c2a3bf93 0x08b42f57 0x08b42ea7
     1:  8388712 [     1:  8388712] @ 0x086ad229 0x0886c9d7 0x08aaba0e 0x08ae23b9 0x08ada093 0x08ad9f89 0x7f06c2d9b4aa 0x086b4a95 0x086bd9be
     1:  8388712 [     1:  8388712] @ 0x086ad229 0x08758fd1 0x08add728 0x08acf20c 0x08acf06b 0x08adba18 0x08647c19 0x0872cff6 0x0872ccc9 0x7f06c2d9b4aa 0x12fd9340 0x0872ccc9
     1:  8388712 [     1:  8388712] @ 0x086ad229 0x086b0aaf 0x086b0a2c 0x08ad5e84 0x08ad5e28 0x7f06c2d9b4aa 0xb0963b1d7f458d34 0x7f06c04f56d0
     1:  8388712 [     1:  8388712] @ 0x086ad229 0x08758fd1 0x08add728 0x08acf20c 0x08acf06b 0x08adba18 0x08647c19 0x088972ae 0x086e514a 0x086e3c81 0x7f06c2a3bf93 0x086e514a 0x086e3c81
     1:  4608280 [     1:  4608280] @ 0x0e0eac2a 0x08a99ef3 0x0872b8fb 0x0872f94f 0x0872d22b 0x0872ccc9 0x7f06c2d9b4aa 0x00000000 0x00000000
gperf 的 heap profiler 输出的每一行表示一个内存分配的样本。每个样本表示一个或多个相同的内存分配。每行的格式如下:
n: t [k: s] @ stack_trace
下面是每个字段的含义:
n:这个数字表示在当前采样中,有多少个相同的内存分配。在例子中,每个样本都只有一个内存分配,所以这个数字都是 1。t:这个数字表示这些内存分配总共分配了多少字节。[k: s]:这个方括号中的数字表示在程序启动后,有多少个相同的内存分配(k),以及这些内存分配总共分配了多少字节(s)。这可以帮助你了解这个内存分配在程序的生命周期中的行为。@ stack_trace:这个部分表示内存分配发生的堆栈跟踪。这个堆栈跟踪是从分配内存的函数开始,到 main 函数结束。每个数字都是一个函数的地址。
在例子中,最大的内存分配是在地址 0x0e0eac44 的函数中发生的,它分配了 20367388 字节的内存。可以使用 addr2line 或其他工具,将这个地址转换为源代码中的文件名和行号,以帮助找到这个内存分配发生的位置。
EVERYTHING IN ONE (同时支持CPU和Heap分析)
If you want the CPU profiler, heap profiler, and heap leak-checker to
all be available for your application, you can do:
   gcc -o myapp ... -lprofiler -ltcmalloc

However, if you have a reason to use the static versions of the
library, this two-library linking won't work:
   gcc -o myapp ... /usr/lib/libprofiler.a /usr/lib/libtcmalloc.a  # errors!

Instead, use the special libtcmalloc_and_profiler library, which we
make for just this purpose:
   gcc -o myapp ... /usr/lib/libtcmalloc_and_profiler.a
ENVIRONMENT VARIABLES (环境变量)
The cpu profiler, heap checker, and heap profiler will lie dormant,
using no memory or CPU, until you turn them on.  (Thus, there's no
harm in linking -lprofiler into every application, and also -ltcmalloc
assuming you're ok using the non-libc malloc library.)

The easiest way to turn them on is by setting the appropriate
environment variables.  We have several variables that let you
enable/disable features as well as tweak parameters.

Here are some of the most important variables:

HEAPPROFILE=<pre> -- turns on heap profiling and dumps data using this prefix
HEAPCHECK=<type>  -- turns on heap checking with strictness 'type'
CPUPROFILE=<file> -- turns on cpu profiling and dumps data to this file.
PROFILESELECTED=1 -- if set, cpu-profiler will only profile regions of code
                     surrounded with ProfilerEnable()/ProfilerDisable().
CPUPROFILE_FREQUENCY=x-- how many interrupts/second the cpu-profiler samples.

PERFTOOLS_VERBOSE=<level> -- the higher level, the more messages malloc emits
MALLOCSTATS=<level>    -- prints memory-use stats at program-exit

For a full list of variables, see the documentation pages:
   docs/cpuprofile.html
   docs/heapprofile.html
   docs/heap_checker.html
PERFORMANCE
If you're interested in some third-party comparisons of tcmalloc to
other malloc libraries, here are a few web pages that have been
brought to our attention.  The first discusses the effect of using
various malloc libraries on OpenLDAP.  The second compares tcmalloc to
win32's malloc.
  http://www.highlandsun.com/hyc/malloc/
  http://gaiacrtn.free.fr/articles/win32perftools.html

It's possible to build tcmalloc in a way that trades off faster
performance (particularly for deletes) at the cost of more memory
fragmentation (that is, more unusable memory on your system).  See the
INSTALL file for details.
PROFILE: interrupts/evictions/bytes = 0/0/64 (没有输出profile文件)
issue 1
According to the gperftools documentation, the profiler can be started using any of the following methods:
-
Setting the
CPUPROFILEenvironment variable to the filename the profile information will be saved to -
Doing the above, and also setting
CPUPROFILESIGNALand sending the appropriate signal to start or stop the sampling. -
Calling
ProfilerStart(filename)andProfileStop()directly from your code
All three methods require that libprofiler.so be linked as well.
When I tried this, the third method worked, but when I merely set CPUPROFILE, no profiling information was generated.
issue 2
My program runs for about 2 minutes, still get PROFILE: interrupts/evictions/bytes = 0/0/64… But after add strace to monitor syscall, weirdly it begin to sample PROFILE: interrupts/evictions/bytes = 150/3/9240 Have no idea why…
Found that if I run program in foreground, gperf samples correctly. But if I run it in daemon mode, gperf fails to sample…
Well, I found this cpuprofiler only profiler parent process (not fork child) #463
The workaround in that issue solved my problem.
解决方法
// CPU profile
#include "gperftools/profiler.h"

ProfilerStart("cpu.prof");
// ...
ProfilerFlush();
ProfilerStop();


// Heap profile
#include "gperftools/heap-profiler.h"

HeapProfilerStart("heap.prof");
// ...
HeapProfilerDump("over")
HeapProfilerStop();
- I’ve set the CPUPROFILE environment variable and linked -lprofiler. Why is gperftools not starting the profiler?
- PROFILE: interrupts/evictions/bytes = 0/0/64 #1012
- cpuprofiler only profiler parent process (not fork child) #463
64-BIT LINUX Issue (死锁问题)
NOTE FOR 64-BIT LINUX SYSTEMS

The glibc built-in stack-unwinder on 64-bit systems has some problems
with the perftools libraries.  (In particular, the cpu/heap profiler
may be in the middle of malloc, holding some malloc-related locks when
they invoke the stack unwinder.  The built-in stack unwinder may call
malloc recursively, which may require the thread to acquire a lock it
already holds: deadlock.)
可能的解决方法:
If you encounter problems, try compiling perftools with './configure
--enable-frame-pointers'.  Note you will need to compile your
application with frame pointers (via 'gcc -fno-omit-frame-pointer
...') in this case.
heapcheck not work correctly
Two possibilities here.  One is that normal mode doesn't consider leaks in main to be
a leak -- I forget the exact rules here.  You can test it by running HEAPCHECK=strict
and seeing what happens.

The other possibility is that the heap-checker is just missing this leak.  As the output
says:
} No leaks found for check "_main_" (but no 100% guarantee that there aren't any):

In general, allocations that happen very close to program exit are most likely for
the heap-checker to miss.  (Luckily, they're also the least dangerous.)

Both possibilities could be in play. :-)

Either way, I believe this is expected behavior.
heapcheck not work correctly. Is it a “live memory” problem? #384
Refer
- https://github.com/gperftools/gperftools
- C++Profile的大杀器_gperftools的使用
- 用gperftools对C/C++程序进行profile
- Work with Google performance tools