Perf in Action
- Linux performance events subsystem
- perf: Linux profiling with performance counters
- Counting with perf stat
- Sampling with perf record
- Sample analysis with perf report
- Source level analysis with perf annotate
- Live analysis with perf top
- Example Usage
- Visualizations
- Q&A
- Refer
Linux performance events subsystem
- The perf event subsystem was merged into the Linux kernel in version
2.6.31and introduced thesys_perf_event_opensystem call. - Uses specail purpose registers on the CPU to count the number of “events”
- An HW(Hardware) event can be, for example, the number of cache miss suffered or mispredicted branches
- SW(Software) events, like page misses, are also supported
- Performance counters are accessed via file descriptors using the above mentioned system call
perfif an user space utility that is part of the kernel repository- Basic usage: data is collected by using the
perf-record(Run a command and record its profile into perf.data) tool and displayed withperf-report(Read perf.data created by perf record and display the profile)
WHY DO WE CARE?
- The Linux Performance Events Subsystem provides a low overhead way to measure the workloads of a single application or the full system
- It’s at least an order of magnitude faster than an instrumenting profiler
- It provides far more information compared to statistical profiler
WHAT IS MISSING
- Annotating the objdump output one event at a time is not enough for efficiently finding bottlenecks
- A real GUI that can display multiple events and their relations is missing
- New CPU’s have a buffer that records the last taken branches but a support to exploit it is missing
PERF EVNETS CONVERTER
- As a first step a converter tool for the perf-tools data format has been introduced
- The tool is capable to convert a perf data file to a
callgrindone that can be displayed withkcachegrind- multiple events are supported
- annotated source code, assembly and function list view
- complete inline chain
- The callgrind converter and the new GUI under development will offer an easy way to non experts to navigate and understand the profiled application
PERF EVENTS VISUALIZER
- KCachegrind doesn’t permit to show an arbitrary number of events at the same time
- A new converter and a web-based GUI is under development
- The converter reads the raw perf data file and produces spreadsheets, cycle accounting trees and call graphs
- The GUI will be able to:
- present the available data in spreadsheets, cycle accounting trees and callgraphs
- offer insights on the callgraph, e.g. mark as hot virtual methods with high call counts
- correlate different HW/SW events to gain a deeper understanding of the performance bottlenecks
perf: Linux profiling with performance counters
…More than just counters…
perf also called perf_events. perf is powerful: it can instrument CPU performance counters, tracepoints, kprobes, and uprobes (dynamic tracing). It is capable of lightweight profiling. It is also included in the Linux kernel, under tools/perf, and is frequently updated and enhanced.
perf began as a tool for using the performance counters subsystem in Linux, and has had various enhancements to add tracing capabilities.
Performance counters are CPU hardware registers that count hardware events such as instructions executed, cache-misses suffered, or branches mispredicted. They form a basis for profiling applications to trace dynamic control flow and identify hotspots. perf provides rich generalized abstractions over hardware specific capabilities. Among others, it provides per task, per CPU and per-workload counters, sampling on top of these and source code event annotation.
Tracepoints are instrumentation points placed at logical locations in code, such as for system calls, TCP/IP events, file system operations, etc. These have negligible overhead when not in use, and can be enabled by the perf command to collect information including timestamps and stack traces. perf can also dynamically create tracepoints using the kprobes and uprobes frameworks, for kernel and userspace dynamic tracing. The possibilities with these are endless.
Command
The perf tool offers a rich set of commands to collect and analyze performance and trace data. The command line usage is reminiscent of git in that there is a generic tool, perf, which implements a set of commands: stat, record, report, …
The list of supported commands:
perf

 usage: perf [--version] [--help] COMMAND [ARGS]

 The most commonly used perf commands are:
  annotate        Read perf.data (created by perf record) and display annotated code
  archive         Create archive with object files with build-ids found in perf.data file
  bench           General framework for benchmark suites
  buildid-cache   Manage <tt>build-id</tt> cache.
  buildid-list    List the buildids in a perf.data file
  diff            Read two perf.data files and display the differential profile
  inject          Filter to augment the events stream with additional information
  kmem            Tool to trace/measure kernel memory(slab) properties
  kvm             Tool to trace/measure kvm guest os
  list            List all symbolic event types
  lock            Analyze lock events
  probe           Define new dynamic tracepoints
  record          Run a command and record its profile into perf.data
  report          Read perf.data (created by perf record) and display the profile
  sched           Tool to trace/measure scheduler properties (latencies)
  script          Read perf.data (created by perf record) and display trace output
  stat            Run a command and gather performance counter statistics
  test            Runs sanity tests.
  timechart       Tool to visualize total system behavior during a workload
  top             System profiling tool.

 See 'perf help COMMAND' for more information on a specific command.
Certain commands require special support in the kernel and may not be available. To obtain the list of options for each command, simply type the command name followed by -h:
perf stat -h

 usage: perf stat [<options>] [<command>]

    -e, --event <event>   event selector. use 'perf list' to list available events
    -i, --no-inherit      child tasks do not inherit counters
    -p, --pid <n>         stat events on existing process id
    -t, --tid <n>         stat events on existing thread id
    -a, --all-cpus        system-wide collection from all CPUs
    -c, --scale           scale/normalize counters
    -v, --verbose         be more verbose (show counter open errors, etc)
    -r, --repeat <n>      repeat command and print average + stddev (max: 100)
    -n, --null            null run - dont start any counters
    -B, --big-num         print large numbers with thousands' separators
Events
The perf tool supports a list of measurable events. The tool and underlying kernel interface can measure events coming from different sources. For instance, some event are pure kernel counters, in this case they are called software events. Examples include: context-switches, minor-faults.
Another source of events is the processor itself and its Performance Monitoring Unit (PMU). It provides a list of events to measure micro-architectural events such as the number of cycles, instructions retired, L1 cache misses and so on. Those events are called PMU hardware events or hardware events for short. They vary with each processor type and model.
The perf_events interface also provides a small set of common hardware events monikers. On each processor, those events get mapped onto an actual events provided by the CPU, if they exists, otherwise the event cannot be used. Somewhat confusingly, these are also called hardware events and hardware cache events.
Finally, there are also tracepoint events which are implemented by the kernel ftrace infrastructure. Those are only available with the 2.6.3x and newer kernels.
To obtain a list of supported events:
perf list

List of pre-defined events (to be used in -e):

 cpu-cycles OR cycles                       [Hardware event]
 instructions                               [Hardware event]
 cache-references                           [Hardware event]
 cache-misses                               [Hardware event]
 branch-instructions OR branches            [Hardware event]
 branch-misses                              [Hardware event]
 bus-cycles                                 [Hardware event]

 cpu-clock                                  [Software event]
 task-clock                                 [Software event]
 page-faults OR faults                      [Software event]
 minor-faults                               [Software event]
 major-faults                               [Software event]
 context-switches OR cs                     [Software event]
 cpu-migrations OR migrations               [Software event]
 alignment-faults                           [Software event]
 emulation-faults                           [Software event]

 L1-dcache-loads                            [Hardware cache event]
 L1-dcache-load-misses                      [Hardware cache event]
 L1-dcache-stores                           [Hardware cache event]
 L1-dcache-store-misses                     [Hardware cache event]
 L1-dcache-prefetches                       [Hardware cache event]
 L1-dcache-prefetch-misses                  [Hardware cache event]
 L1-icache-loads                            [Hardware cache event]
 L1-icache-load-misses                      [Hardware cache event]
 L1-icache-prefetches                       [Hardware cache event]
 L1-icache-prefetch-misses                  [Hardware cache event]
 LLC-loads                                  [Hardware cache event]
 LLC-load-misses                            [Hardware cache event]
 LLC-stores                                 [Hardware cache event]
 LLC-store-misses                           [Hardware cache event]

 LLC-prefetch-misses                        [Hardware cache event]
 dTLB-loads                                 [Hardware cache event]
 dTLB-load-misses                           [Hardware cache event]
 dTLB-stores                                [Hardware cache event]
 dTLB-store-misses                          [Hardware cache event]
 dTLB-prefetches                            [Hardware cache event]
 dTLB-prefetch-misses                       [Hardware cache event]
 iTLB-loads                                 [Hardware cache event]
 iTLB-load-misses                           [Hardware cache event]
 branch-loads                               [Hardware cache event]
 branch-load-misses                         [Hardware cache event]

 rNNN (see 'perf list --help' on how to encode it) [Raw hardware event descriptor]

 mem:<addr>[:access]                        [Hardware breakpoint]

 kvmmmu:kvm_mmu_pagetable_walk              [Tracepoint event]

 [...]

 sched:sched_stat_runtime                   [Tracepoint event]
 sched:sched_pi_setprio                     [Tracepoint event]
 syscalls:sys_enter_socket                  [Tracepoint event]
 syscalls:sys_exit_socket                   [Tracepoint event]

 [...]
Counting with perf stat
For any of the supported events, perf can keep a running count during process execution. In counting modes, the occurrences of events are simply aggregated and presented on standard output at the end of an application run. To generate these statistics, use the stat command of perf. For instance:
# perf stat ./perf_stat_example
pid: 24298

 Performance counter stats for './perf_stat_example':

       1251.260398      task-clock (msec)         #    0.980 CPUs utilized
               107      context-switches          #    0.086 K/sec
                 0      cpu-migrations            #    0.000 K/sec
            48,878      page-faults               #    0.039 M/sec
   <not supported>      cycles
   <not supported>      instructions
   <not supported>      branches
   <not supported>      branch-misses

       1.276480272 seconds time elapsed
With no events specified, perf stat collects the common events listed above. Some are software events, such as context-switches, others are generic hardware events such as cycles. After the hash sign, derived metrics may be presented, such as ‘IPC’ (instructions per cycle).
Options controlling event selection
It is possible to measure one or more events per run of the perf tool. Events are designated using their symbolic names followed by optional unit masks and modifiers. Event names, unit masks, and modifiers are case insensitive.
By default, events are measured at both user and kernel levels:
# perf stat -e context-switches,page-faults ./perf_stat_example
pid: 26956

 Performance counter stats for './perf_stat_example':

                87      context-switches
            48,880      page-faults

       1.260494406 seconds time elapsed
To measure more than one event, simply provide a comma-separated list with no space:
perf stat -e cycles,instructions,cache-misses [...]
Attaching to a running process
It is possible to use perf to attach to an already running thread or process. This requires the permission to attach along with the thread or process ID. To attach to a process, the -p option must be the process ID. To attach to the sshd service that is commonly running on many Linux machines, issue:
# ps ax | grep "sshd -D"
  917 ?        Ss     4:30 /usr/sbin/sshd -D
27561 pts/0    S+     0:00 grep --color=auto sshd -D
# perf stat -p 917
^C
 Performance counter stats for process id '917':

         12.132072      task-clock (msec)         #    0.002 CPUs utilized
                45      context-switches          #    0.004 M/sec
                 0      cpu-migrations            #    0.000 K/sec
               640      page-faults               #    0.053 M/sec
   <not supported>      cycles
   <not supported>      instructions
   <not supported>      branches
   <not supported>      branch-misses

       5.384885419 seconds time elapsed
Even though we are attaching to a process, we can still pass the name of a command. It is used to time the measurement. Without it, perf monitors until it is killed.
Also note that when attaching to a process, all threads of the process are monitored. Furthermore, given that inheritance is on by default, child processes or threads will also be monitored. To turn this off, you must use the -i option. It is possible to attach a specific thread within a process. By thread, we mean kernel visible thread. In other words, a thread visible by the ps or top commands. To attach to a thread, the -t option must be used.
$perf stat -p 39911 sleep 3

 Performance counter stats for process id '39911':

        131.862207      task-clock (msec)         #    0.044 CPUs utilized
            12,148      context-switches          #    0.092 M/sec
                59      cpu-migrations            #    0.447 K/sec
                 4      page-faults               #    0.030 K/sec
                 0      cycles                    #    0.000 GHz
                 0      stalled-cycles-frontend   #    0.00% frontend cycles idle
                 0      stalled-cycles-backend    #    0.00% backend  cycles idle
                 0      instructions              #    0.00  insns per cycle
                 0      branches                  #    0.000 K/sec
                 0      branch-misses             #    0.000 K/sec

       3.001477374 seconds time elapsed
We look at rsyslogd, because it always runs on Ubuntu, with multiple threads. (使用 -t 采样指定的线程)
# ps -L ax | fgrep rsyslogd
  914   914 ?        Ssl    0:00 /usr/sbin/rsyslogd -n
  914   942 ?        Ssl    1:44 /usr/sbin/rsyslogd -n
  914   943 ?        Ssl    0:00 /usr/sbin/rsyslogd -n
  914   944 ?        Ssl    1:39 /usr/sbin/rsyslogd -n
29083 29083 pts/0    S+     0:00 grep -F --color=auto rsyslogd
# perf stat -t 942 sleep 2

 Performance counter stats for thread id '942':

          0.045408      task-clock (msec)         #    0.000 CPUs utilized
                 3      context-switches          #    0.066 M/sec
                 0      cpu-migrations            #    0.000 K/sec
                 0      page-faults               #    0.000 K/sec
   <not supported>      cycles
   <not supported>      instructions
   <not supported>      branches
   <not supported>      branch-misses

       2.000827441 seconds time elapsed
In this example, the thread 942 did not run during the 2s of the measurement. Otherwise, we would see a count value. Attaching to kernel threads is possible, though not really recommended. Given that kernel threads tend to be pinned to a specific CPU, it is best to use the cpu-wide mode.
Options controlling output
perf stat can modify output to suit different needs.
- Pretty printing large numbers
For most people, it is hard to read large numbers. With perf stat, it is possible to print large numbers using the comma separator for thousands (US-style). For that the -B option and the correct locale for LC_NUMERIC must be set.
- Machine readable output
perf stat can also print counts in a format that can easily be imported into a spreadsheet or parsed by scripts. The -x option alters the format of the output and allows users to pass a field delimiter. This makes is easy to produce CSV-style output. Note that the -x option is not compatible with -B.
# perf stat -x, date
Mon Jun 21 16:37:07 CST 2021
0.524149,,task-clock,524149,100.00,0.046,CPUs utilized
3,,context-switches,524149,100.00,0.006,M/sec
0,,cpu-migrations,524149,100.00,0.000,K/sec
66,,page-faults,524149,100.00,0.126,M/sec
<not supported>,,cycles,0,100.00,,
<not supported>,,instructions,0,100.00,,
<not supported>,,branches,0,100.00,,
<not supported>,,branch-misses,0,100.00,,
Sampling with perf record
The perf tool can be used to collect profiles on per-thread, per-process and per-cpu basis.
There are several commands associated with sampling: record, report, annotate. You must first collect the samples using perf record. This generates an output file called perf.data. That file can then be analyzed, possibly on another machine, using the perf report and perf annotate commands.
Period and rate
The perf_events interface allows two modes to express the sampling period:
- the number of occurrences of the event (
period) (即,-c 200) - the average rate of samples/sec (
frequency) (即,-F 1000)
The perf tool defaults to the average rate. It is set to 1000Hz, or 1000 samples/sec. That means that the kernel is dynamically adjusting the sampling period to achieve the target average rate. The adjustment in period is reported in the raw profile data. In contrast, with the other mode, the sampling period is set by the user and does not vary between samples. There is currently no support for sampling period randomization.
Collecting samples
By default, perf record operates in per-thread mode, with inherit mode enabled. The simplest mode looks as follows, when executing a simple program that busy loops:
perf record ./noploop 1

[ perf record: Woken up 1 times to write data ]
[ perf record: Captured and wrote 0.002 MB perf.data (~89 samples) ]
The example above collects samples for event cycles at an average target rate of 1000Hz. The resulting samples are saved into the perf.data file. If the file already existed, you may be prompted to pass -f to overwrite it. To put the results in a specific file, use the -o option.
WARNING: The number of reported samples is only an estimate. It does not reflect the actual number of samples collected. The estimate is based on the number of bytes written to the perf.data file and the minimal sample size. But the size of each sample depends on the type of measurement. Some samples are generated by the counters themselves but others are recorded to support symbol correlation during post-processing, e.g., mmap() information.
To get an accurate number of samples for the perf.data file, it is possible to use the perf report command:
perf record ./noploop 1

[ perf record: Woken up 1 times to write data ]
[ perf record: Captured and wrote 0.058 MB perf.data (~2526 samples) ]
perf report -D -i perf.data | fgrep RECORD_SAMPLE | wc -l

1280
To specify a custom rate, it is necessary to use the -F option. For instance, to sample on event instructions only at the user level and at an average rate of 250 samples/sec:
perf record -e instructions:u -F 250 ./noploop 4

[ perf record: Woken up 1 times to write data ]
[ perf record: Captured and wrote 0.049 MB perf.data (~2160 samples) ]
To specify a sampling period, instead, the -c option must be used. For instance, to collect a sample every 2000 occurrences of event instructions only at the user level only:
perf record -e retired_instructions:u -c 2000 ./noploop 4

[ perf record: Woken up 55 times to write data ]
[ perf record: Captured and wrote 13.514 MB perf.data (~590431 samples) ]
Sample analysis with perf report
Samples collected by perf record are saved into a binary file called, by default, perf.data. The perf report command reads this file and generates a concise execution profile. By default, samples are sorted by functions with the most samples first. It is possible to customize the sorting order and therefore to view the data differently.
perf report

# Events: 1K cycles
#
# Overhead          Command                   Shared Object  Symbol
# ........  ...............  ..............................  .....................................
#
    28.15%      firefox-bin  libxul.so                       [.] 0xd10b45
     4.45%          swapper  [kernel.kallsyms]               [k] mwait_idle_with_hints
     4.26%          swapper  [kernel.kallsyms]               [k] read_hpet
     2.13%      firefox-bin  firefox-bin                     [.] 0x1e3d
     1.40%  unity-panel-ser  libglib-2.0.so.0.2800.6         [.] 0x886f1
     [...]
- The column ‘Overhead’ indicates the percentage of the overall samples collected in the corresponding function.
- The second column reports the process from which the samples were collected. In per-thread/per-process mode, this is always the name of the monitored command. But in cpu-wide mode, the command can vary.
- The third column shows the name of the ELF image where the samples came from. If a program is dynamically linked, then this may show the name of a shared library. When the samples come from the kernel, then the pseudo ELF image name
kernel.kallsymsis used. - The fourth column indicates the privilege level at which the sample was taken, i.e. when the program was running when it was interrupted:
[.] user level
[k] kernel level
[g] guest kernel level (virtualization)
[u] guest os user space
[H] hypervisor
- The final column shows the symbol name.
Options controlling output
To make the output easier to parse, it is possible to change the column separator to a single character:
# perf report -t ","

Samples: 302K of event 'cpu-clock', Event count (approx.): 302077
  4.48%,gamesvr,[vdso]                      ,[.] 0x0000000000000e6c
  4.37%,gamesvr,libc-2.17.so                ,[.] _dl_addr
  3.78%,gamesvr,gamesvr                     ,[.] JLib::my_gettimeofday(timeval*)
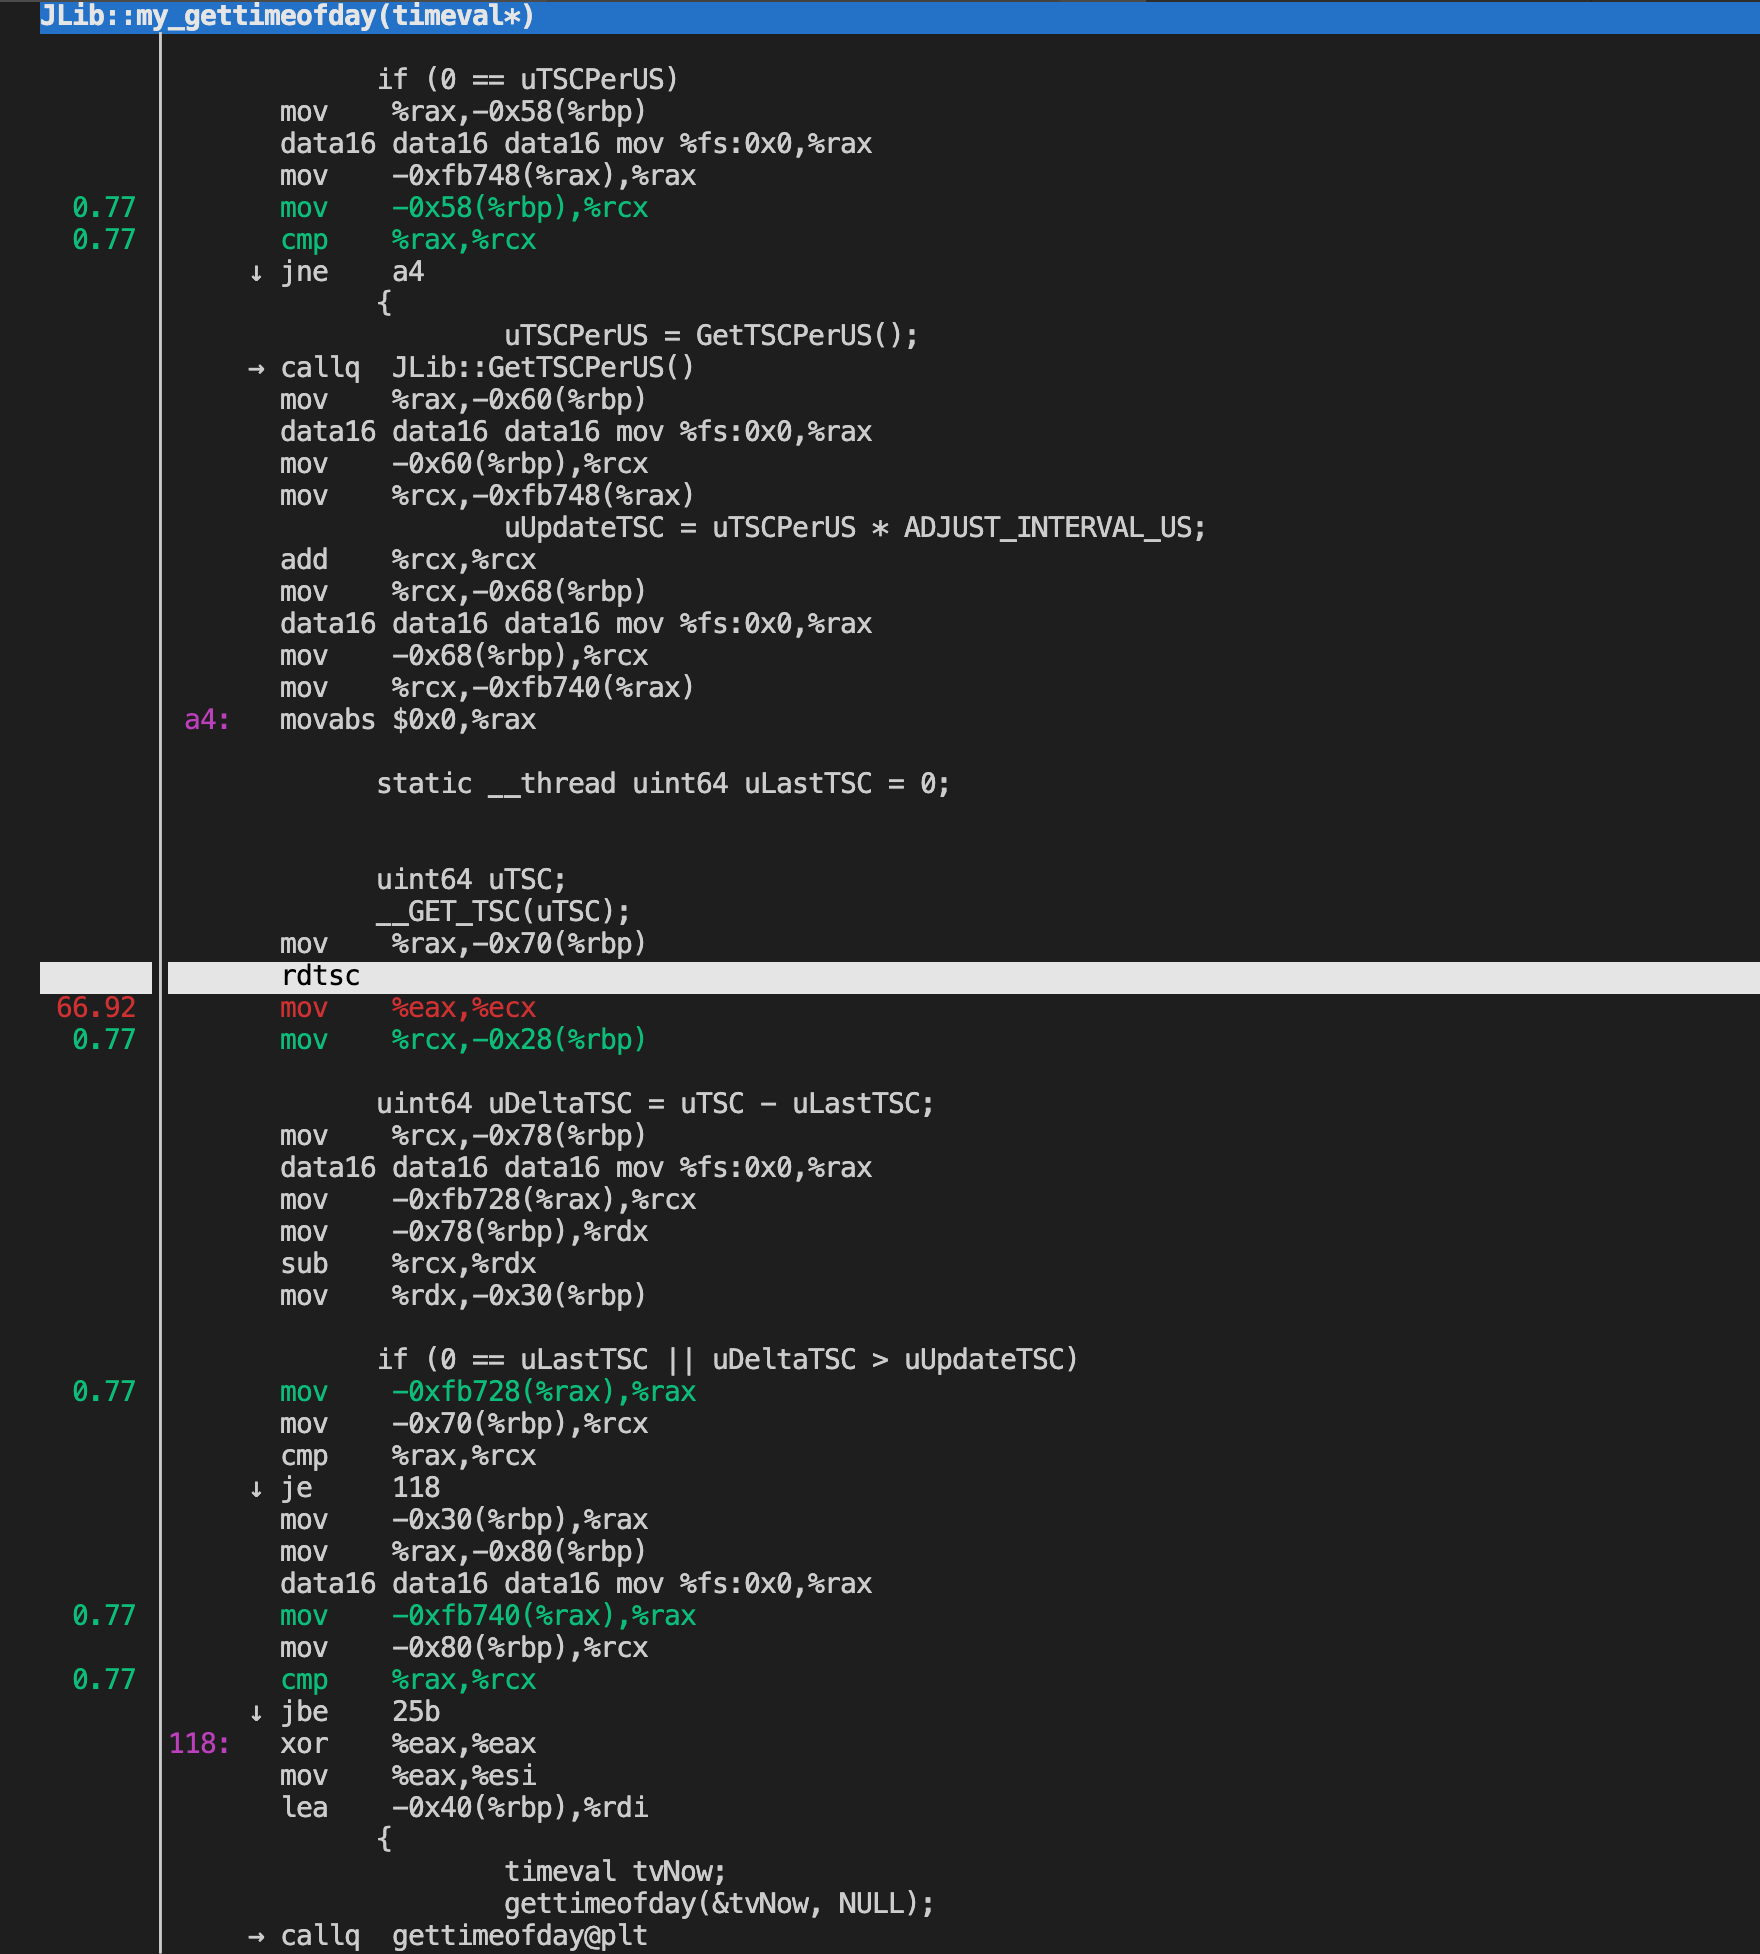
Source level analysis with perf annotate
It is possible to drill down to the instruction level with perf annotate. For that, you need to invoke perf annotate with the name of the command to annotate. All the functions with samples will be disassembled and each instruction will have its relative percentage of samples reported:
# perf record -c 1000 ./perf_top_example
# perf annotate
perf annotate can generate sourcecode level information if the application is compiled with -ggdb.
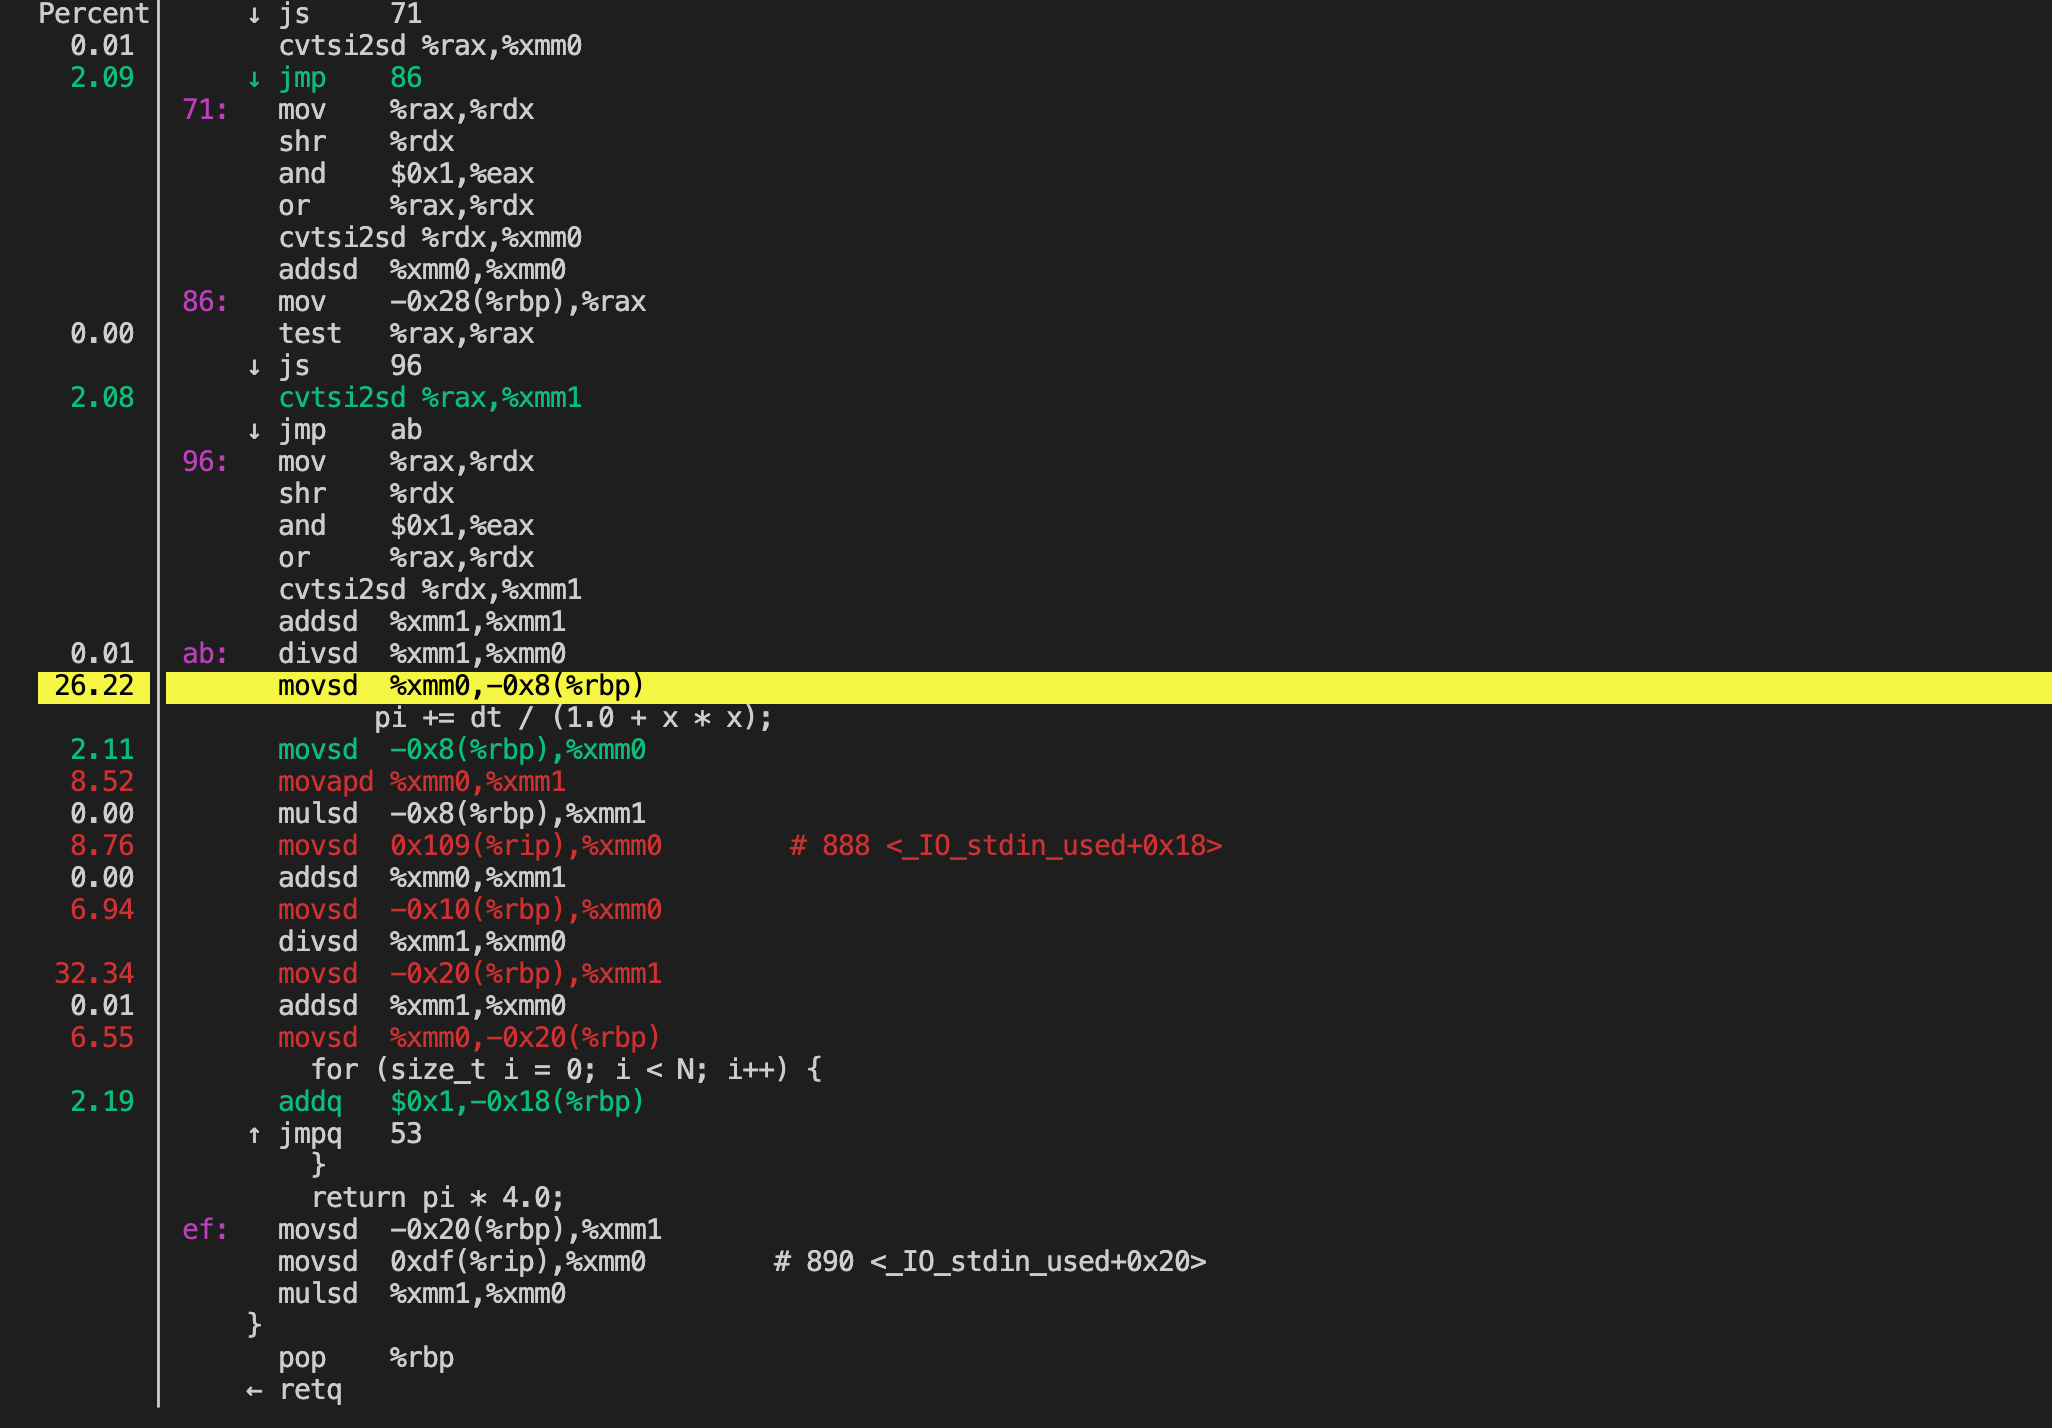
通过perf top选择对应的函数回车也可以调用perf annotate显示代码。
Live analysis with perf top
The perf tool can operate in a mode similar to the Linux top tool, printing sampled functions in real time. The default sampling event is cycles and default order is descending number of samples per symbol, thus perf top shows the functions where most of the time is spent. By default, perf top operates in processor-wide mode, monitoring all online CPUs at both user and kernel levels. It is possible to monitor only a subset of the CPUS using the -C option.
perf top
-------------------------------------------------------------------------------------------------------------------------------------------------------
  PerfTop:     260 irqs/sec  kernel:61.5%  exact:  0.0% [1000Hz
cycles],  (all, 2 CPUs)
-------------------------------------------------------------------------------------------------------------------------------------------------------

            samples  pcnt function                       DSO
            _______ _____ ______________________________ ___________________________________________________________

              80.00 23.7% read_hpet                      [kernel.kallsyms]
              14.00  4.2% system_call                    [kernel.kallsyms]
              14.00  4.2% __ticket_spin_lock             [kernel.kallsyms]
              14.00  4.2% __ticket_spin_unlock           [kernel.kallsyms]
               8.00  2.4% hpet_legacy_next_event         [kernel.kallsyms]
               7.00  2.1% i8042_interrupt                [kernel.kallsyms]
               7.00  2.1% strcmp                         [kernel.kallsyms]
               6.00  1.8% _raw_spin_unlock_irqrestore    [kernel.kallsyms]
               6.00  1.8% pthread_mutex_lock             /lib/i386-linux-gnu/libpthread-2.13.so
               6.00  1.8% fget_light                     [kernel.kallsyms]
               6.00  1.8% __pthread_mutex_unlock_usercnt /lib/i386-linux-gnu/libpthread-2.13.so
               5.00  1.5% native_sched_clock             [kernel.kallsyms]
               5.00  1.5% drm_addbufs_sg                 /lib/modules/2.6.38-8-generic/kernel/drivers/gpu/drm/drm.ko
Example Usage
系统环境:
$ cat /etc/issue
Ubuntu 18.04.1 LTS \n \l
$ uname -r
4.15.0-29-generic
$ cat "/boot/config-`uname -r`" | grep "PERF_EVENT"
CONFIG_HAVE_PERF_EVENTS=y
CONFIG_PERF_EVENTS=y
CONFIG_HAVE_PERF_EVENTS_NMI=y
CONFIG_PERF_EVENTS_INTEL_UNCORE=y
CONFIG_PERF_EVENTS_INTEL_RAPL=m
CONFIG_PERF_EVENTS_INTEL_CSTATE=m
# CONFIG_PERF_EVENTS_AMD_POWER is not set
CONFIG_SECURITY_PERF_EVENTS_RESTRICT=y
perf --help
perf record --help
perf report --help
Counting Events
# CPU counter statistics for the specified PID, until Ctrl-C
perf stat -p $pid

# CPU counter statistics for the entire system, for 5 seconds
perf stat -a sleep 5

# Various basic CPU statistics, system wide, for 10 seconds:
perf stat -e cycles,instructions,cache-references,cache-misses,bus-cycles -a sleep 10

# Count syscalls per-second system-wide:
perf stat -e raw_syscalls:sys_enter -I 1000 -a

# Count system calls by type for the specified PID, until Ctrl-C:
perf stat -e 'syscalls:sys_enter_*' -p PID

# Count block device I/O events for the entire system, for 10 seconds:
perf stat -e 'block:*' -a sleep 10
Profiling
# Sample on-CPU functions for the specified command, at 99 Hertz:
perf record -F 99 command

# Sample on-CPU functions for the specified PID, at 99 Hertz, until Ctrl-C:
perf record -F 99 -p PID

# Sample on-CPU functions for the specified PID, at 99 Hertz, for 10 seconds:
perf record -F 99 -p PID sleep 10

# Sample CPU stack traces (via frame pointers) for the specified PID, at 99 Hertz, for 10 seconds:
perf record -F 99 -p PID -g -- sleep 10

# Sample CPU stack traces for the entire system, at 99 Hertz, for 10 seconds (< Linux 4.11):
perf record -F 99 -ag -- sleep 10

# Sample CPU stack traces for the entire system, at 99 Hertz, for 10 seconds (>= Linux 4.11):
perf record -F 99 -g -- sleep 10

# If the previous command didn't work, try forcing perf to use the cpu-clock event:
perf record -F 99 -e cpu-clock -ag -- sleep 10

# Sample CPUs at 49 Hertz, and show top addresses and symbols, live (no perf.data file):
perf top -F 49

# Sample CPUs at 49 Hertz, and show top process names and segments, live:
perf top -F 49 -ns comm,dso
Static Tracing
# Trace new processes, until Ctrl-C:
perf record -e sched:sched_process_exec -a

# Sample (take a subset of) context-switches, until Ctrl-C:
perf record -e context-switches -a

# Trace all context-switches, until Ctrl-C:
perf record -e context-switches -c 1 -a

# Sample context-switches with stack traces, until Ctrl-C:
perf record -e context-switches -ag

# Sample minor faults (RSS growth) with stack traces, until Ctrl-C:
perf record -e minor-faults -ag

# Sample page faults with stack traces, until Ctrl-C:
perf record -e page-faults -ag
Dynamic Tracing
# Add a tracepoint for the kernel tcp_sendmsg() function entry ("--add" is optional):
perf probe --add tcp_sendmsg

# Remove the tcp_sendmsg() tracepoint (or use "--del"):
perf probe -d tcp_sendmsg
Reporting
# Show perf.data in an ncurses browser (TUI) if possible:
perf report

# Show perf.data with a column for sample count:
perf report -n

# Show perf.data as a text report, with data coalesced and percentages:
perf report --stdio

# Disassemble and annotate instructions with percentages (needs some debuginfo):
perf annotate --stdio
测试代码
# perf record -c 1000 ./perf_top_example
pid: 13985
[ perf record: Woken up 16 times to write data ]
[ perf record: Captured and wrote 3.948 MB perf.data (128706 samples) ]
# perf report -U --stdio | head -n 20
# To display the perf.data header info, please use --header/--header-only options.
#
#
# Total Lost Samples: 0
#
# Samples: 128K of event 'cpu-clock'
# Event count (approx.): 128706000
#
# Overhead  Command          Shared Object      Symbol
# ........  ...............  .................  ..................................
#
    99.90%  perf_top_exampl  perf_top_example   [.] _Z19compute_pi_baselinem
     0.01%  perf_top_exampl  [kernel.kallsyms]  [k] exit_to_usermode_loop
     0.01%  perf_top_exampl  [kernel.kallsyms]  [k] unmap_page_range
     0.00%  perf_top_exampl  [kernel.kallsyms]  [k] filemap_map_pages
     0.00%  perf_top_exampl  [kernel.kallsyms]  [k] __softirqentry_text_start
     0.00%  perf_top_exampl  [kernel.kallsyms]  [k] finish_task_switch
     0.00%  perf_top_exampl  [kernel.kallsyms]  [k] __do_page_fault
     0.00%  perf_top_exampl  [kernel.kallsyms]  [k] _raw_spin_unlock_irqrestore
     0.00%  perf_top_exampl  [kernel.kallsyms]  [k] iowrite16
- Options included
-ato trace all CPUs, and-gto capture call graphs (stack traces).
更多用法:Brendan Gregg’s perf examples
Visualizations
perf_events has a builtin visualization: timecharts, as well as text-style visualization via its text user interface (TUI) and tree reports.
refer:
Flame Graphs
Flame Graphs can be produced from perf_events profiling data using the FlameGraph tools software. This visualizes the same data you see in perf report, and works with any perf.data file that was captured with stack traces (-g).
-a, --all-cpus
  System-wide collection from all CPUs (default if no target is specified).
-g
  Enables call-graph (stack chain/backtrace) recording.
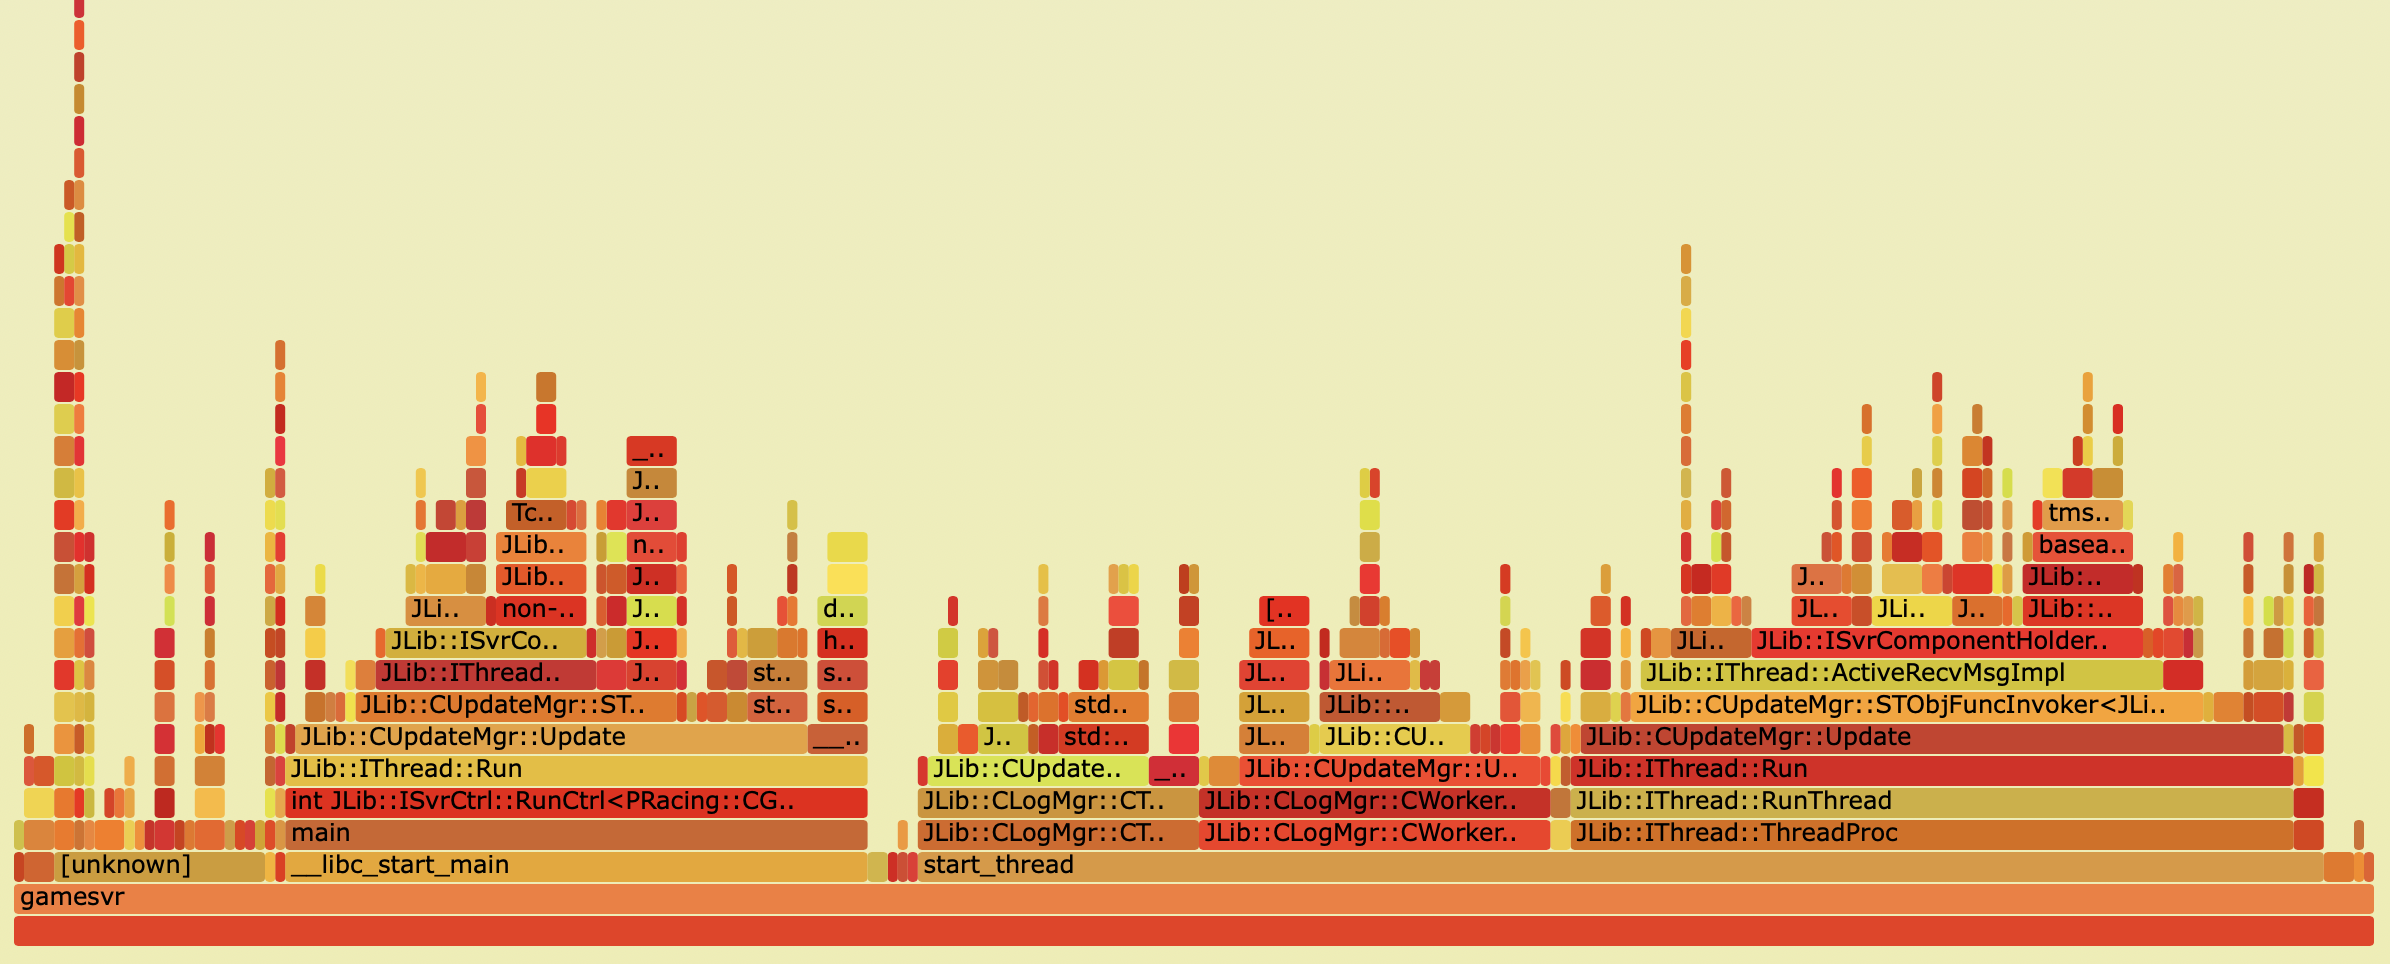
Flame graphs are a visualization of profiled software, allowing the most frequent code-paths to be identified quickly and accurately. They can be generated using open source programs on github.com/brendangregg/FlameGraph, which create interactive SVGs.
The following pages (or posts) introduce different types of flame graphs:
CPU火焰图示例:MySQL CPU flame graph
The x-axis shows the stack profile population, sorted alphabetically (it is not the passage of time), and the y-axis shows stack depth, counting from zero at the bottom. Each rectangle represents a stack frame. The wider a frame is is, the more often it was present in the stacks. The top edge shows what is on-CPU, and beneath it is its ancestry. The colors are usually not significant, picked randomly to differentiate frames.
Flame Graphs Explained (关于火焰图的更多解释):
A flame graph visualizes a collection of stack traces (aka call stacks), shown as an adjacency diagram with an inverted icicle layout. Flame graphs are commonly used to visualize CPU profiler output, where stack traces are collected using sampling.
A flame graph has the following characteristics:
- A stack trace is represented as a column of boxes, where each box represents a function (a stack frame). (每个格子可以看做一个function)
- The
y-axisshows the stack depth, ordered from root at the bottom to leaf at the top. The top box shows the function that was on-CPU when the stack trace was collected, and everything beneath that is its ancestry. The function beneath a function is its parent. (垂直方向:下面的function调用上面的function) - The
x-axisspans the stack trace collection. It does not show the passage of time, so the left-to-right ordering has no special meaning. The left-to-right ordering of stack traces is performed alphabetically on the function names, from the root to the leaf of each stack. This maximizes box merging: when identical function boxes are horizontally adjacent, they are merged. (水平方向:左右顺序没有特别的含义) - The width of each function box shows the frequency at which that function was present in the stack traces, or part of a stack trace ancestry. Functions with wide boxes were more present in the stack traces than those with narrow boxes, in proportion to their widths. (格子的宽度,表示function被调用的频率,宽度越宽,调用频率越高)
- If the width of the box is sufficient, it displays the full function name. If not, either a truncated function name with an ellipsis is shown, or nothing. (如果格子宽度足够,则会显示完整的function名字,否则只显示部分,或者什么也不显示)
- The background color for each box is not significant and is picked at random to be a warm hue. This randomness helps the eye differentiate boxes, especially for adjacent thin “towers.” Other color schemes are discussed later. (每个格子的背景颜色是随机分配的没有特殊的含义,主要是为了方便查看)
Flame Graph Interpretation
Flame graphs can be interpreted as follows:
- The top edge of the flame graph shows the function that was running on the CPU when the stack trace was collected. For CPU profiles, this is the function that is directly consuming CPU cycles. For other profile types, this is the function that directly led to the instrumented event.
- Look for large plateaus along the top edge, as these show a single stack trace was frequently present in the profile. For CPU profiles, this means a single function was frequently running on-CPU. (最上面的function是频繁在CPU运行的函数)
- Reading top down shows ancestry. A function was called by its parent, which is shown directly below it; the parent was called by its parent shown below it, and so on. A quick scan downward from a function identifies why it was called. (从上往下看)
- Reading bottom up shows code flow and the bigger picture. A function calls any child functions shown above it, which, in turn, call functions shown above them. Reading bottom up also shows the big picture of code flow before various forks split execution into smaller towers. (从下往上看)
- The width of function boxes can be directly compared: wider boxes mean a greater presence in the profile and are the most important to understand first.
- For CPU profiles that employ timed sampling of stack traces, if a function box is wider than another, this may be because it consumes more CPU per function call or that the function was simply called more often. The function-call count is not shown or known via sampling. (对于CPU,越宽的function表示消耗CPU越多,或者这个function被调用次数越多)
- Major forks in the flame graph, spotted as two or more large towers atop a single function, can be useful to study. They can indicate a logical grouping of code, where a function processes work in stages, each with its own function. It can also be caused by a conditional statement, which chooses which function to call.
More: 如何读懂火焰图?
Interpretation Example
As an example of interpreting a flame graph, consider the mock one shown below. Imagine this is visualizing a CPU profile, collected using timed samples of stack traces (as is typical).
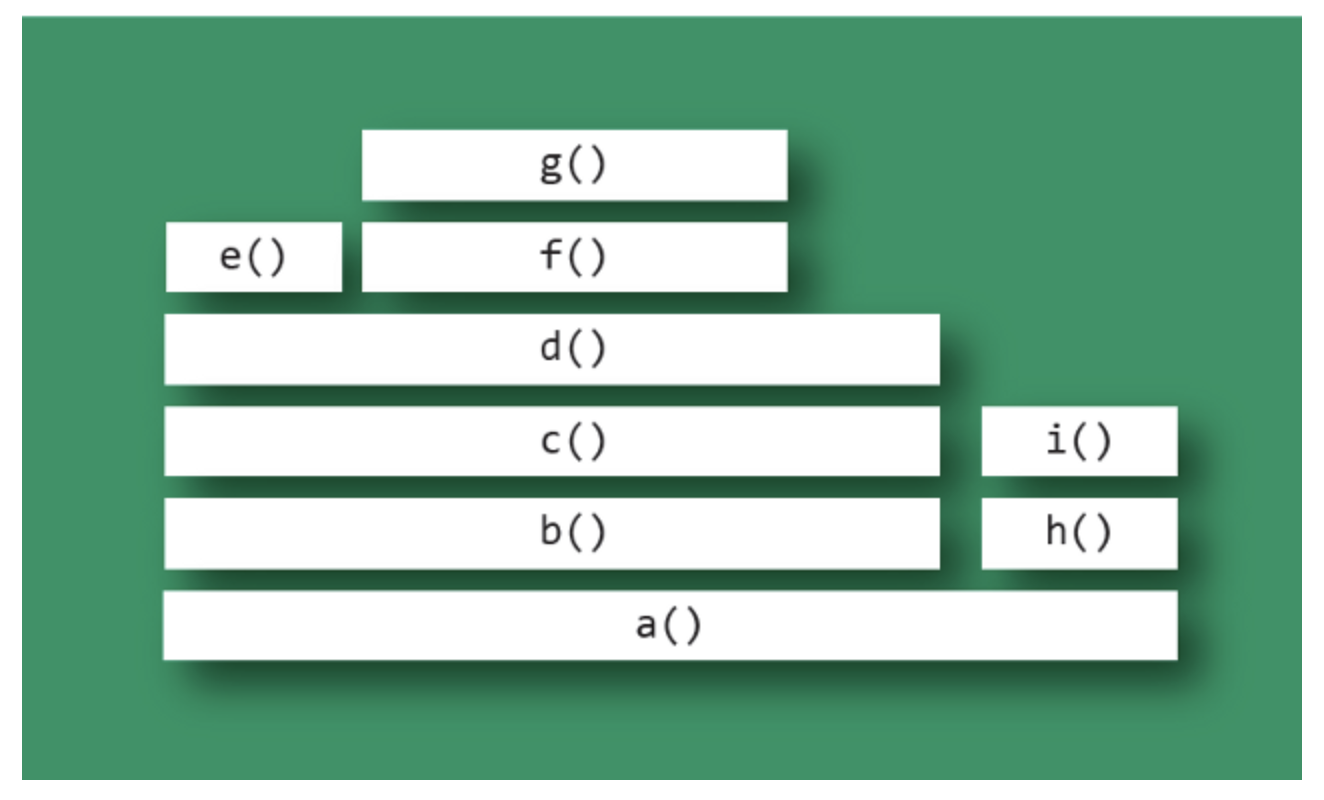
The top edge shows that function g() is on-CPU the most; d() is wider, but its exposed top edge is on-CPU the least. Functions including b() and c() do not appear to have been sampled on-CPU directly; rather, their child functions were running.
Functions beneath g() show its ancestry: g() was called by f(), which was called by d(), and so on.
Visually comparing the widths of functions b() and h() shows that the b() code path was on-CPU about four times more than h(). The actual functions on-CPU in each case were their children.
A major fork(分叉) in the code paths is visible where a() calls b() and h(). Understanding why the code does this may be a major clue to its logical organization. This may be the result of a conditional (if conditional, call b(), else call h()) or a logical grouping of stages (where a() is processed in two parts: b() and h()).
Challenges
Challenges with flame graphs mostly involve system profilers and not flame graphs themselves. There are two typical problems with profilers:
- Stack traces are incomplete. Some system profilers truncate to a fixed stack depth (e.g., 10 frames), which must be increased to capture the full stack traces, or else frame merging can fail. A worse problem is when the software compiler reuses the frame pointer register as a compiler optimization, breaking the typical method of stack-trace collection. The fix requires either a different compiled binary (e.g., using gcc’s -fno-omit-frame-pointer) or a different stack-walking technique.
- Function names are missing. In this case, the stack trace is complete, but many function names are missing and may be represented as hexadecimal addresses. This commonly happens with JIT (just-in-time) compiled code, which may not create a standard symbol table for profilers. Depending on the profiler and runtime, there are different fixes. For example, Linux perf_events supports supplemental symbol files, which the application can create.
Usage
快速用法:
perf record -F 99 -a -g -- sleep 60
perf script | stackcollapse-perf.pl | flamegraph.pl > out.svg
具体用法介绍:
Using Linux perf_events (aka “perf”) to capture 60 seconds of 99 Hertz stack samples, both user- and kernel-level stacks, all processes:
# perf record -F 99 -a -g -- sleep 60
# perf script > out.perf
Now only capturing PID 181:
# perf record -F 99 -p 181 -g -- sleep 60
# perf script > out.perf
Use the stackcollapse programs to fold stack samples into single lines. The programs provided are:
- stackcollapse-perf.pl: for Linux perf_events “perf script” output
- stackcollapse-go.pl: for Golang pprof stacks
For perf_events:
$ ./stackcollapse-perf.pl out.perf > out.folded
Use flamegraph.pl to render a SVG.’
./flamegraph.pl out.kern_folded > kernel.svg
关于flamegraph.pl的更多用法:
USAGE: ./flamegraph.pl [options] infile > outfile.svg

--title TEXT     # change title text
--subtitle TEXT  # second level title (optional)
--width NUM      # width of image (default 1200)
--height NUM     # height of each frame (default 16)
--minwidth NUM   # omit smaller functions (default 0.1 pixels)
--fonttype FONT  # font type (default "Verdana")
--fontsize NUM   # font size (default 12)
--countname TEXT # count type label (default "samples")
--nametype TEXT  # name type label (default "Function:")
--colors PALETTE # set color palette. choices are: hot (default), mem,
                 # io, wakeup, chain, java, js, perl, red, green, blue,
                 # aqua, yellow, purple, orange
--bgcolors COLOR # set background colors. gradient choices are yellow
                 # (default), blue, green, grey; flat colors use "#rrggbb"
--hash           # colors are keyed by function name hash
--cp             # use consistent palette (palette.map)
--reverse        # generate stack-reversed flame graph
--inverted       # icicle graph
--flamechart     # produce a flame chart (sort by time, do not merge stacks)
--negate         # switch differential hues (blue<->red)
--notes TEXT     # add notes comment in SVG (for debugging)
--help           # this message

eg,
./flamegraph.pl --title="Flame Graph: malloc()" trace.txt > graph.svg
可以把生成的SVG图片拖拽到浏览器中查看:
An advantage of having the folded input file (and why this is separate to flamegraph.pl) is that you can use grep for functions of interest. Eg:
grep cpuid out.kern_folded | ./flamegraph.pl > cpuid.svg
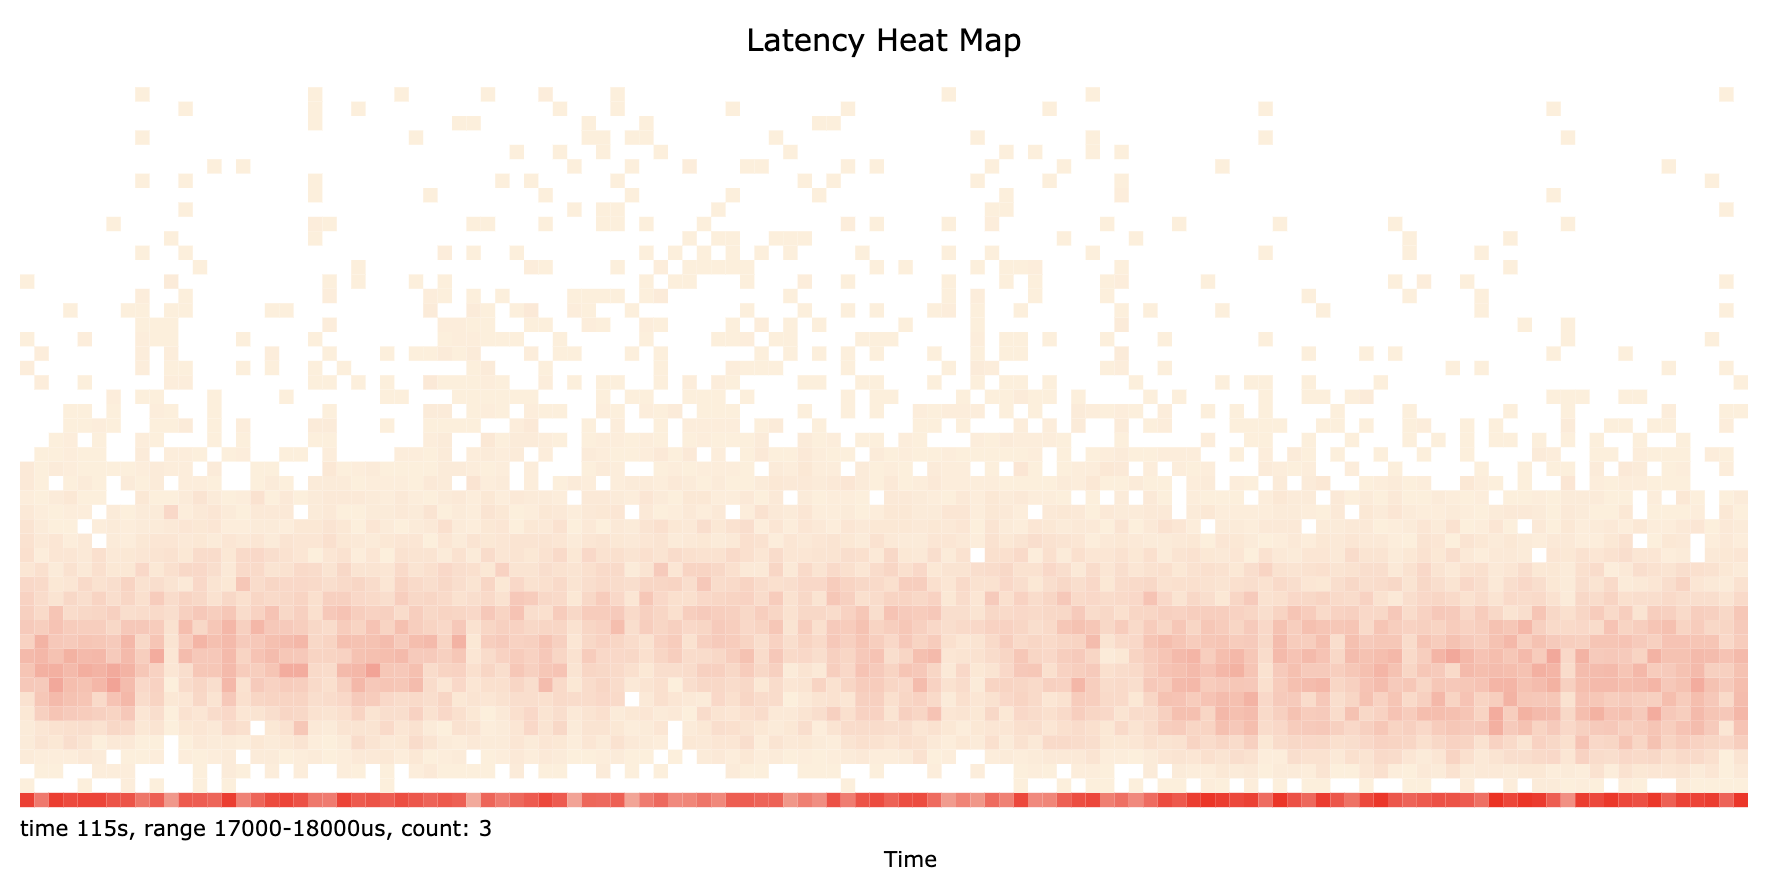
Heat Maps
See http://www.brendangregg.com/perf.html 7.2 Heat Maps.
Since perf_events can record high resolution timestamps (microseconds) for events, some latency measurements can be derived from trace data.
Q&A
perf top -t $tid
When I use the perf record on my code, I find three choices for the --call-graph option: lbr (last branch record), dwarf and fp. What is difference between these?
perf record -h

--call-graph <record_mode[,record_size]>
                          setup and enables call-graph (stack chain/backtrace):

                                record_mode:    call graph recording mode (fp|dwarf|lbr)
                                record_size:    if record_mode is 'dwarf', max size of stack recording (<bytes>)
                                                default: 8192 (bytes)

                                Default: fp
The option --call-graph refers to the collection of call graphs / call chains, i.e. the function stack for a sample.
The default, fp, uses frame pointers. This is very efficient but can be unreliable, particularly for optimized code. By explicitly using -fno-omit-frame-pointer, you can ensure that this is available for your code. Nevertheless, the result for libraries may vary.
With dwarf, perf actually collects and stores a part of the stack memory itself and unwinds it with post-processing. This can be very resource consuming and may have limited stack depth. The default stack memory chunk is 8 kiB, but can be configured.
lbr stands for last branch records. This is a hardware mechanism support by Intel CPUs. This will probably offer the best performance at the cost of portability. lbr is also limited to userspace functions.