TCMalloc in Action
- TCMalloc 版本实现差异
- TCMalloc Overview
- Documentation
- Publications
- Prerequisites
- tcmalloc 与 gperftools 的关系
- 单独构建 tcmalloc
- 通过构建 gperftools 得到 tcmalloc
- Running the TCMalloc Hello World
- Creating and Running TCMalloc
- TCMalloc : Thread-Caching Malloc
- 分配原理
- Understanding Malloc Stats
- 测试代码
- The libunwind project
- 通过 LD_PRELOAD 使用 tcmalloc
- Performance Tuning TCMalloc
- Benchmark
- Q&A
- Refer
TCMalloc 版本实现差异
注意:https://github.com/google/tcmalloc 和 https://github.com/gperftools/gperftools 两个仓库 TCMalloc 的实现并不一样,前者的实现更新一些,而 gperftools 的版本目前还使用 Thread Cache 的工作模式。可参考:gperftools do not have SetMaxPerCpuCacheSize() #1516
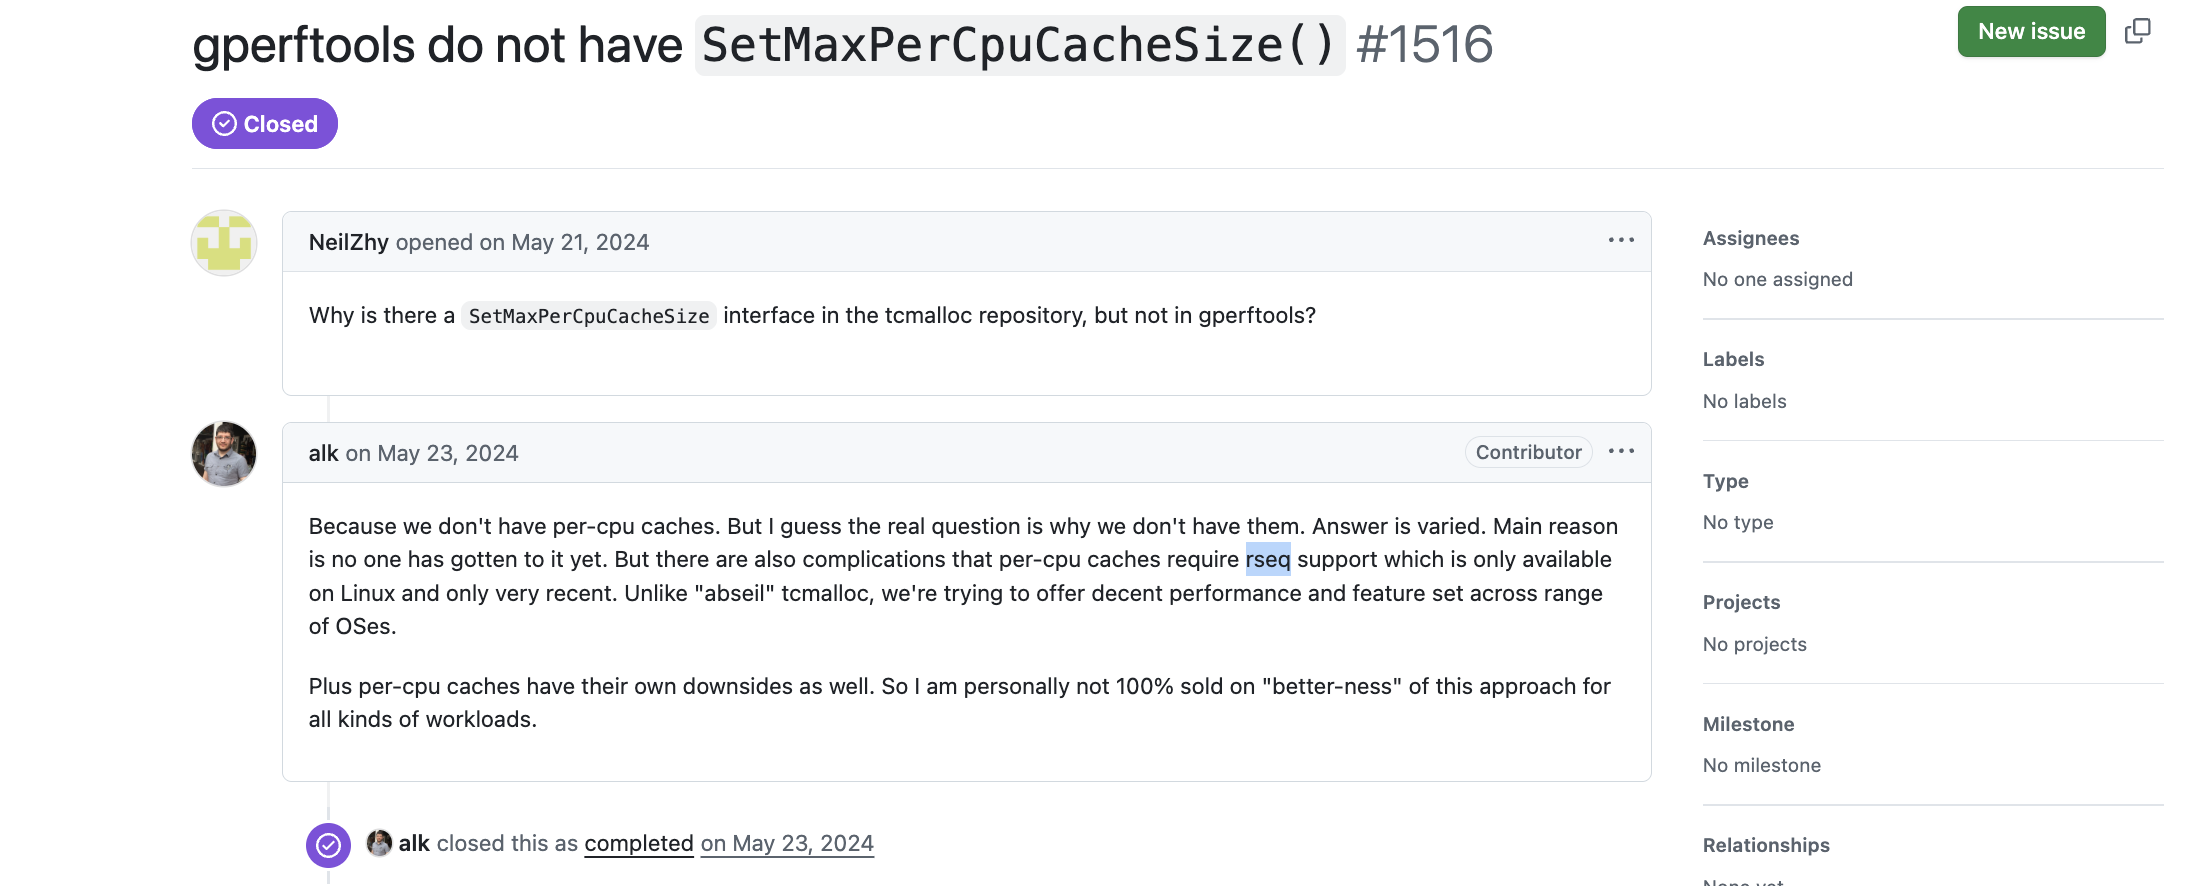
https://github.com/google/tcmalloc 版本目前默认使用的是 CPU Cache 的工作模式,通过上面的 issue 可以看到,gperftools 版本的 TCMalloc 没有提供 CPU Cache 的优化,原因是依赖 Linux 4.18 内核提供的 rseq 系统调用,Linux 4.18 内核支持 TCMalloc per-CPU 工作模式下 Restartable Sequence 优化(乐观并发+重试),避免了传统同步机制(如互斥锁、原子操作)带来的显著性能损耗。参考:https://kib.kiev.ua/kib/rseq.pdf
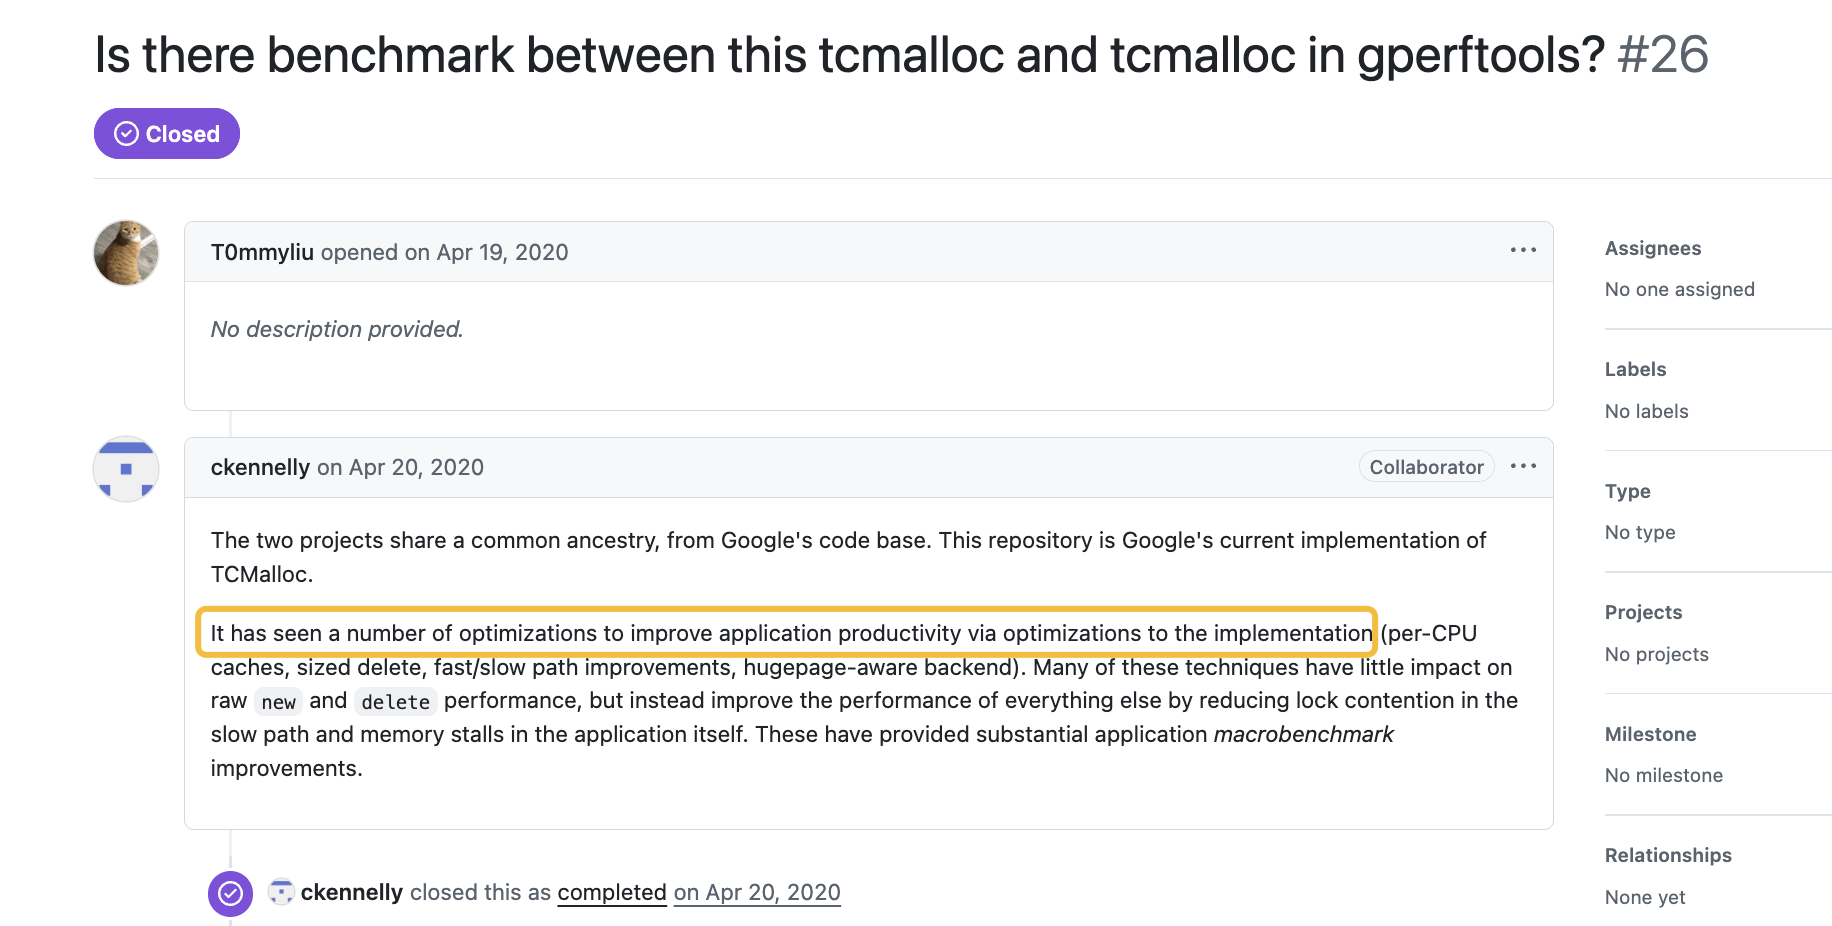
另外可参考:Is there benchmark between this tcmalloc and tcmalloc in gperftools? #26,https://github.com/google/tcmalloc 版本实现是 Google 目前最新的实现,添加了很多新的优化,包括:per-CPU caches, sized delete, fast/slow path improvements, hugepage-aware backend 等。
TCMalloc Overview
TCMalloc is Google’s customized implementation of C’s malloc() and C++’s operator new used for memory allocation within our C and C++ code. This custom memory allocation framework is an alternative to the one provided by the C standard library (on Linux usually through glibc) and C++ standard library. TCMalloc is designed to be more efficient at scale than other implementations.
Specifically, TCMalloc provides the following benefits:
- Performance scales with highly parallel applications.
- Optimizations brought about with recent C++14 and C++17 standard enhancements, and by diverging slightly from the standard where performance benefits warrant. (These are noted within the TCMalloc Reference.)
- Extensions to allow performance improvements under certain architectures, and additional behavior such as metric gathering.
传统分配器 (glibc) 的瓶颈
- 全局锁争用:多线程并发分配时,glibc malloc 的锁竞争导致性能塌陷
- 缓存局部性差:内存分配跨线程跳跃,CPU 缓存命中率骤降
graph LR
    A[线程1分配内存] -->|竞争全局锁| B[中央堆]
    C[线程2分配内存] -->|阻塞等待| B
    D[线程N分配内存] -->|高并发时严重争抢| B
TCMalloc 的并行化架构
- 64 核机器上,分配速度提升 3-5 倍
- 99% 的小对象分配完全避开锁争用
三级缓存设计:
| 层级 | 作用 | 并发控制 |
|---|---|---|
| Per-CPU 缓存 | 线程本地快速分配 | 完全无锁 |
| 中央缓存 | 批量转移内存到 Per-CPU 缓存 | 分桶锁 (Sharded) |
| PageHeap | 管理大块内存 (≥256KiB) | 粒度锁 |
graph LR
    A[线程1] -->|无锁访问| B[Per-CPU 缓存]
    C[线程2] -->|无锁访问| D[Per-CPU 缓存]
    E[线程N] -->|无锁访问| F[Per-CPU 缓存]
    B & D & F -->|异步填充| G[中央缓存]
    G --> H[PageHeap]
对 C++14/17 标准的极致优化
| C++ 特性 | TCMalloc 优化策略 | 性能收益 |
|---|---|---|
noexcept |
移除分配路径的异常检查分支 | 减少 5-7% 指令开销 |
| 对齐分配 | 利用硬件特性加速 align_val_t 实现 |
对齐分配耗时降低 40% |
| 内存消耗跟踪 | 整合 std::pmr 接口,零成本扩展监控 |
无运行时开销 |
refer: 深入探索C++17:资源管理新机制与 std::pmr 命名空间, 详解 std::pmr::unordered_map 的应用
突破标准的性能取舍,示例:尺寸无关删除 (Sized Delete)
// 标准行为:需查询对象尺寸
delete ptr;

// TCMalloc 扩展:直接传递尺寸(编译器支持)
operator delete(ptr, size); // 非标准但高效
- 收益:释放操作减少 1 次中央缓存查询
- 代价:违反标准但实测加速 15% 释放路径
架构与场景的深度适配
硬件敏感优化:
| 硬件特性 | TCMalloc 利用方式 | 场景案例 |
|---|---|---|
| NUMA 架构 | Per-CPU 缓存绑定物理核,避免跨节点访问 | 8 路 Xeon 服务器 |
| HugePages | 主动合并 2MB 大页降低 TLB Miss | 内存 > 64GiB 的数据库 |
| TSX 指令集 | 中央缓存采用硬件事务内存减少锁冲突 | 高争用 Web 服务 |
可观测性增强:
// 通过 MallocExtension 获取内部指标
auto metrics = tcmalloc::MallocExtension::GetProperties();
cout << "堆内存: "
     << metrics["generic.heap_size"] << " bytes";

// 实时采样内存分配来源
MallocExtension::SnapshotCurrent(AllocationProfilingToken);
关键指标:
- tcmalloc.cpu_cache.total_used_bytes
- tcmalloc.pageheap.free_bytes
- tcmalloc.central_cache_free.count
生产价值:
- 精准定位内存碎片来源
- 动态调整缓存策略避免 OOM
TCMalloc Cache Operation Mode
TCMalloc may operate in one of two fashions:
- (default) per-CPU caching, where TCMalloc maintains memory caches local to individual logical cores. Per-CPU caching is enabled when running TCMalloc on any Linux kernel that utilizes restartable sequences (
RSEQ). Support forRSEQwas merged in Linux 4.18.
Linux 4.18 内核支持 TCMalloc per-CPU 工作模式下 Restartable Sequence 优化(乐观并发+重试),避免了传统同步机制(如互斥锁、原子操作)带来的显著性能损耗。参考:https://kib.kiev.ua/kib/rseq.pdf
- per-thread caching, where TCMalloc maintains memory caches local to each application thread. If
RSEQis unavailable, TCMalloc reverts to using this legacy behavior.
NOTE: the “TC” in TCMalloc refers to Thread Caching, which was originally a distinguishing feature of TCMalloc; the name remains as a legacy.
In both cases, these cache implementations allows TCMalloc to avoid requiring locks for most memory allocations and deallocations.
结合 TCMalloc 的两种工作模式(per-CPU caching 和 per-thread caching),rseq 带来的核心优化效果:将“线程局部缓存”升级为“CPU核心局部缓存”,并在此过程中彻底消除锁和原子操作的开销,显著提升高频内存分配/释放操作的性能。
简单来说:rseq 让 TCMalloc 能够安全地“相信”线程短时间内不会被踢出当前 CPU 核心。基于这个乐观假设,它可以无锁、无原子操作地飞速操作该核心专属的内存缓存。即使偶尔假设错了(被踢走了),内核也能帮忙安全地“回滚”并让 TCMalloc 重试。这种机制让高频的内存操作快如闪电。 这就是为什么
per-CPU caching依赖rseq且性能远超传统的per-thread caching。
refer:
- Restartable Sequence Mechanism for TCMalloc
- What are RSEQs (Restartable Sequences) and how to use them?
- Restartable sequences in glibc
rseq(Restartable Sequences)系统调用的核心优化效果在于为用户空间程序提供了一种高效、低开销的方式来安全地访问和更新“每 CPU”(per-CPU)数据,同时避免了传统同步机制(如互斥锁、原子操作)带来的显著性能损耗。它本质上是在用户态实现了一种“乐观并发控制”机制。
原理解释:
消除锁开销
传统方式:在用户空间安全地操作共享数据(尤其是每 CPU 数据)通常需要使用互斥锁(mutexes)或读写锁(rwlocks)。即使冲突概率很低,获取和释放锁本身也涉及昂贵的系统调用(futex)或原子操作(CAS, compare-and-swap),这些操作会强制缓存失效(cache invalidation),显著增加延迟并降低吞吐量。
rseq 方式:rseq 允许程序员定义一个“临界区”(critical section),其核心思想是:假设在临界区的执行过程中,线程不会被抢占或迁移到其他 CPU 上。如果这个假设成立(这是常见情况),那么临界区内的操作就可以完全在用户态无锁地、直接地访问和修改该 CPU 上的每 CPU 数据,速度极快。只有当小概率的“意外事件”(如抢占、信号、迁移)发生时,内核才会介入并“重启”这个序列。
减少原子操作开销
传统方式:对于简单的计数器累加等操作,使用原子指令(如 fetch_add)是常见的替代锁的方案。虽然避免了锁争用,但原子指令本身也比普通指令慢得多(它们需要总线锁定或缓存一致性协议操作),并且在多核竞争激烈时会导致严重的缓存行颠簸(cache line bouncing)。
rseq 方式:在 rseq 保护的临界区内,可以直接使用普通的内存读写指令(如 inc [mem])来修改每 CPU 数据。只要线程在该 CPU 上不被中断地完成操作,这些修改就是安全的,无需昂贵的原子操作。这大大降低了指令开销和缓存压力。
避免不必要的缓存失效
锁和原子操作通常涉及修改共享状态(锁变量本身或原子变量),这会触发 CPU 缓存一致性协议,导致其他 CPU 核心上相关的缓存行失效。当其他线程随后访问这些数据时,必须从内存或远程缓存重新加载,造成延迟。
rseq 方式:由于 rseq 临界区直接操作的是当前 CPU 核心的私有每 CPU 数据(假设没有冲突),这些修改通常只影响当前核心的本地缓存。其他核心的缓存不受影响,避免了不必要的缓存失效和跨核通信开销。这对于高频访问的数据(如计数器、指针)性能提升巨大。
最小化内核态/用户态切换
传统方式:使用锁(如 mutex)通常涉及到陷入内核态(通过 futex 系统调用)进行阻塞或唤醒操作。即使是无锁算法中的原子操作也可能隐含一些内核同步原语的开销(虽然主要在用户态)。
rseq 方式:在“无冲突”的理想路径(fast path)上,rseq 操作完全在用户态执行,没有任何系统调用或陷入内核的开销。 只有在小概率的“冲突”事件(线程在临界区内被抢占、收到信号或迁移)发生时(slow path),内核才会介入,撤销部分操作并将执行点重置到临界区开始处(或程序员指定的 abort 标签处),让用户态代码重试。这种“乐观执行 + 冲突回滚”机制确保了绝大部分情况下用户态代码能高效运行。
优化高频、低冲突操作
rseq 的优化效果在那些操作本身非常轻量(如简单的内存读写、加法)、但执行频率极高、且冲突概率很低的场景下最为显著。典型的例子包括:
- 高性能计数器:统计网络包、系统调用、内存分配等事件。每 CPU 计数器用 rseq 更新比原子计数器快得多。
- 内存分配器 (Allocators):如 TCMalloc, jemalloc 中的每 CPU 缓存(slabs, free-lists)的管理。频繁的分配/释放操作通过 rseq 更新缓存指针和计数器,避免了锁争用。
- 无锁数据结构:作为构建更复杂无锁数据结构(如队列、栈)的基础原语。
- 性能剖析 (Profiling):高效地记录每 CPU 的性能采样数据。
总结 rseq 的优化机制:
- 乐观假设:假设线程在执行一段关键序列(访问 per-CPU 数据)时不会被抢占或迁移。
- 无锁 Fast Path:在乐观假设成立的情况下,直接在用户态使用普通指令安全地修改 per-CPU 数据,零锁开销、零原子操作开销、零系统调用开销、最小化缓存失效。
- 冲突检测与回滚 (Slow Path):内核负责监控。如果乐观假设被打破(线程在临界区内被抢占/迁移/信号打断),内核检测到冲突,它会:
- 阻止线程在错误状态下修改数据。
- 将线程的程序计数器(PC)重置到临界区的开始处(或程序员指定的 abort 标签)。
- 通知用户态库(通过设置标志或返回错误码)。
- 用户态重试:用户态代码检测到冲突(通过内核设置的状态),可以选择安全地重试整个临界区操作。
rseq 赋能 per-CPU caching (默认 & 优化模式)
-
核心机制:当 TCMalloc 在支持
rseq(Linux 4.18+) 的内核上运行时,它采用per-CPU caching。这意味着 TCMalloc 为每个逻辑 CPU 核心维护独立的内存缓存(slabs 或 free-lists),而不是为每个线程维护。 -
rseq 的关键作用:当线程执行内存分配或释放操作时,需要访问和修改它当前所在 CPU 核心对应的缓存结构(例如,从 free-list 取一个对象放回去,或更新空闲内存计数器)。
- 乐观 Fast Path (无冲突):
rseq允许 TCMalloc 定义一个临界区,在此临界区内,它直接、无锁地操作当前 CPU 核心的缓存。它假设线程在执行这个简短操作时不会被抢占或迁移到其他 CPU 核心。 - 操作方式:在
rseq保护的临界区内,TCMalloc 使用普通的内存读写指令修改当前 CPU 核心的缓存。例如:- 分配:直接从当前 CPU 的 free-list 指针读取一个空闲块地址,然后更新指针指向下一个空闲块。
- 释放:直接将释放的对象插入当前 CPU 的 free-list 头部,更新指针。
- 零锁/零原子操作:这个路径上没有互斥锁 (
mutex),没有自旋锁 (spinlock),没有原子指令 (fetch_add,compare_exchange_strong)。操作速度接近原生内存访问。 - 最小化缓存失效:修改只影响当前核心的 L1/L2 缓存。其他核心的缓存行不会被无效化,避免了跨核通信开销。
- 乐观 Fast Path (无冲突):
- 冲突处理 Slow Path:如果小概率事件发生(线程在临界区内被抢占、收到信号或迁移到其他核心),内核
rseq机制会检测到并:- 阻止线程在错误的 CPU 核心上修改缓存(防止数据损坏)。
- 将线程的程序计数器重置到临界区的开始处。
- 通知 TCMalloc(通过 rseq 相关 API)。
- TCMalloc 的响应:TCMalloc 检测到冲突后,会安全地重试操作。在重试时,它可能:
- 再次尝试操作(因为可能只是短暂中断)。
- 发现线程确实迁移了,则切换到新 CPU 核心对应的缓存进行操作(这可能需要更复杂的处理,但概率很低)。
- 优化效果:对于绝大多数(>99.9%)的内存分配/释放请求,操作都在
rseq的fast path上完成,速度极快,且没有锁或原子操作的开销。这使得高频、小对象的内存操作性能得到质的飞跃。
per-thread caching (备选 & 传统模式)
-
触发条件:当内核不支持
rseq(Linux < 4.18) 或rseq不可用时,TCMalloc 回退到此模式。 -
核心机制:TCMalloc 为每个应用程序线程维护独立的内存缓存。
-
锁/原子操作的开销:虽然每个线程操作自己的缓存通常不需要与其他线程同步(避免了大部分锁争用),但线程迁移问题仍然存在:
- 一个线程可能在 CPU A 上开始分配操作,但被抢占后,被调度到 CPU B 上继续执行。
- 线程的缓存数据在 CPU A 的缓存中可能是热的,但在 CPU B 上就是冷的。
- 更重要的是,为了保证线程在迁移后仍能安全访问“自己的”缓存,TCMalloc 在访问 per-thread 缓存时,通常仍然需要使用原子操作或谨慎的内存屏障指令。这比
rseq的普通内存访问慢得多。 - 即使没有迁移,访问线程局部存储本身也可能比访问一个固定 CPU 核心的存储有轻微的开销(需要加载线程 ID 或查找 TLS 指针)。
-
优化效果局限:
per-thread caching避免了线程间的锁争用,是一个重要的优化(这也是它原名 Thread-Caching Malloc 的来源)。但它无法完全消除原子操作/屏障的开销和缓存局部性问题(因线程迁移导致缓存未命中)。其性能显著低于per-CPU caching。
TCMalloc Features
TCMalloc provides APIs for dynamic memory allocation: malloc() using the C API, and ::operator new using the C++ API. TCMalloc, like most allocation frameworks, manages this memory better than raw memory requests (such as through mmap()) by providing several optimizations:
-
Performs allocations from the operating system by managing specifically-sized chunks of memory (called “pages”). Having all of these chunks of memory the same size allows TCMalloc to simplify bookkeeping.
-
Devoting separate pages (or runs of pages called “Spans” in TCMalloc) to specific object sizes. For example, all 16-byte objects are placed within a “Span” specifically allocated for objects of that size. Operations to get or release memory in such cases are much simpler.
-
Holding memory in caches to speed up access of commonly-used objects. Holding such caches even after deallocation also helps avoid costly system calls if such memory is later re-allocated. The cache size can also affect performance. The larger the cache, the less any given cache will overflow or get exhausted, and therefore require a lock to get more memory. TCMalloc extensions allow you to modify this cache size, though the default behavior should be preferred in most cases. For more information, consult the TCMalloc Tuning Guide.
Additionally, TCMalloc exposes telemetry about the state of the application’s heap via MallocExtension. This can be used for gathering profiles of the live heap, as well as a snapshot taken near the heap’s highwater mark size (a peak heap profile).
内存分配 API 的封装
- 核心接口:TCMalloc 提供标准 C 的
malloc()和 C++ 的::operator new作为内存分配入口。 - 优化目标:相比直接使用
mmap()等系统调用申请原始内存,TCMalloc 通过多层优化减少系统调用次数、降低碎片化、提升分配速度。
内存管理的核心优化机制
统一页管理(Page Management)
- 机制:向操作系统申请大块等尺寸的内存页(通常为 4KB/8KB),而非零散内存。
- 优势:
- 简化内存记账(记录页的使用状态比记录任意大小块更容易)。
- 减少外部碎片(通过页对齐分配)。
按对象尺寸分类的 Span
-
Span 是什么:一个或多个连续内存页组成的逻辑单元(例如 1 页=4KB,Span 可能是 4KB/8KB/12KB…)。
- 关键策略:为不同大小的对象分配专属 Span。例如:
- 所有 16 字节对象存放在专用于 16 字节的 Span 中。
- 所有 32 字节对象存放在另一专用于 32 字节的 Span 中。
- 优势:
- 分配/释放操作简化:只需操作固定大小的空闲链表(Free List),无需复杂搜索。
- 减少内部碎片:Span 内部只存放同尺寸对象,利用率高。
- 快速定位:通过尺寸直接映射到对应 Span,时间复杂度 O(1)。
多级缓存加速
- 缓存层级:
- Per-CPU/Per-Thread 缓存。每个 CPU 核心或线程持有本地小对象缓存。核心作用:避免全局锁争用(>99% 操作无需锁)
- 中央堆(Central Heap)。当本地缓存不足时,从中央堆批量获取内存(需全局锁,但频率低)
- 操作系统(Page Heap)。中央堆不足时,通过
mmap等向操作系统申请新页。
- 缓存优势
- 高频操作无锁化:本地缓存实现无锁分配/释放。
- 复用内存:释放的内存暂存本地缓存,避免立即归还系统(减少
munmap等系统调用)。 - 批量操作:本地缓存耗尽时,从中央堆批量补充多个对象(分摊锁开销)。
缓存大小与性能平衡
- 缓存大小的影响:
- 缓存过小:频繁访问中央堆(需全局锁),性能下降。
- 缓存过大:内存占用过高,可能影响其他进程。
- 调优建议:
- 默认配置已平衡多数场景,无需手动调整。
- 特殊场景(如实时系统/内存敏感应用)可参考 TCMalloc Tuning Guide。
堆内存可观测性(Telemetry)
-
接口:
MallocExtension - 核心功能:
- 实时堆分析(Live Heap Profiling):获取当前内存分配快照(如哪些代码路径分配内存最多)。
- 峰值堆分析(Peak Heap Profiling):记录历史最高内存水位线时的堆状态(定位内存泄漏关键点)。
- 工具整合:数据可导入
pprof等工具生成火焰图,直观展示内存热点。
The TCMalloc API
TCMalloc implements the C and C++ dynamic memory API endpoints from the C11, C++11, C++14, and C++17 standards.
From C++, this includes
- The basic
::operator new,::operator delete, and array variant functions. - C++14’s sized
::operator delete - C++17’s overaligned
::operator newand::operator deletefunctions.
Unlike in the standard implementations, TCMalloc does not throw an exception when allocations fail, but instead crashes directly. Such behavior can be used as a performance optimization for move constructors not currently marked noexcept; such move operations can be allowed to fail directly due to allocation failures. In Abseil, these are enabled with -DABSL_ALLOCATOR_NOTHROW.
From C, this includes malloc, calloc, realloc, and free.
The TCMalloc API obeys the behavior of C90 DR075 and DR445 which states:
The alignment requirement still applies even if the size is too small for any object requiring the given alignment.
In other words, malloc(1) returns alignof(std::max_align_t)-aligned pointer. Based on the progress of N2293, we may relax this alignment in the future.
For more complete information, consult the TCMalloc Reference.
Documentation
All users of TCMalloc should consult the following documentation resources:
-
The TCMalloc Quickstart covers downloading, installing, building, and testing TCMalloc, including incorporating within your codebase.
-
The TCMalloc Overview covers the basic architecture of TCMalloc, and how that may affect configuration choices.
-
The TCMalloc Reference covers the C and C++ TCMalloc API endpoints.
More advanced usages of TCMalloc may find the following documentation useful:
-
The TCMalloc Tuning Guide covers the configuration choices in more depth, and also illustrates other ways to customize TCMalloc.
-
The TCMalloc Design Doc covers how TCMalloc works underneath the hood, and why certain design choices were made. Most developers will not need this level of implementation detail.
-
The TCMalloc Compatibility Guide which documents our expectations for how our APIs are used.
-
The history and differences between this repository and
gperftools.
Publications
We’ve published several papers relating to TCMalloc optimizations:
-
“Beyond malloc efficiency to fleet efficiency: a hugepage-aware memory allocator” (OSDI 2021) relating to the development and rollout of Temeraire, TCMalloc’s hugepage-aware page heap implementation.
-
“Adaptive Hugepage Subrelease for Non-moving Memory Allocators in Warehouse-Scale Computers” (ISMM 2021) relating to optimizations for releasing partial hugepages to the operating system.
-
“Characterizing a Memory Allocator at Warehouse Scale” (ASPLOS 2024) relating to several optimizations developed since 2018.
Prerequisites
Install Bazel (CentOS)
Bazel 安装说明,本文使用方式三。
方式一:安装包
yum install bazel4
方式二:源码编译
方式三:使用release版本
Install python3
yum install -y python36
Install java
yum install -y java-1.8.0-openjdk-devel.x86_64
如果需要运行java程序,只需安装JRE (Java Runtime Environment)。如果需要编写java程序,需要安装JDK (Java Development Kit)。
JRE顾名思义是java运行时环境,包含了java虚拟机,java基础类库。是使用java语言编写的程序运行所需要的软件环境,是提供给想运行java程序的用户使用的。
JDK顾名思义是java开发工具包,是程序员使用java语言编写java程序所需的开发工具包,是提供给程序员使用的。JDK包含了JRE,同时还包含了编译java源码的编译器javac,还包含了很多java程序调试和分析的工具:jconsole,jvisualvm等工具软件,还包含了java程序编写所需的文档和demo例子程序。
Language Requirements
Bazel is the official build system for TCMalloc.
TCMalloc requires a code base that supports C++17 and our code is C++17-compliant. C code is required to be compliant to C11.
We guarantee that our code will compile under the following compilation flags:
Linux:
gcc 9.2+, clang 9.0+: -std=c++17
(TL;DR; All code at this time must be built under C++17. We will update this list if circumstances change.)
To specify which C/C++ compiler the default C++ toolchain in Bazel should use set CC environment variable (e.g. CC=clang bazel build //…).
tcmalloc 与 gperftools 的关系
There are two projects on Github that are based on Google’s internal TCMalloc: This repository and gperftools. Both are fast C/C++ memory allocators designed around a fast path that avoids synchronizing with other threads for most allocations.
This repository is Google’s current implementation of TCMalloc, used by ~all of our C++ programs in production. The code is limited to the memory allocator implementation itself.
History
Google open-sourced its memory allocator as part of “Google Performance Tools” in 2005. At the time, it became easy to externalize code, but more difficult to keep it in-sync with our internal usage, as discussed by Titus Winters’ in his 2017 CppCon Talk and the “Software Engineering at Google” book. Subsequently, our internal implementation diverged from the code externally. This project eventually was adopted by the community as “gperftools.”
gperftools 是从一个更早的实现中分叉出来的,这个早期实现曾经是外包的,后来独立发展。gperftools 代表了 Google 内部实现的一个较新的快照(不仅仅是一个分叉,而且是主动同步的)。
Differences
Since “Profiling a Warehouse-Scale Computer” (Kanev 2015), we have invested in improving application productivity via optimizations to the implementation (per-CPU caches, sized delete, fast/slow path improvements, hugepage-aware backend).
Because this repository reflects our day-to-day usage, we’ve focused on the platforms we regularly use and can see extensive testing and optimization.
This implementation is based on Abseil. Like Abseil, we do not attempt to provide ABI stability. Providing a stable ABI could require compromising performance or adding otherwise unneeded complexity to maintain stability. These caveats are noted in our Compatibility Guidelines.
In addition to a memory allocator, the gperftools project contains a number of other tools:
-
An All-Allocation Memory Profiler: We have found this prohibitively costly to use regularly, and instead focus on using low-overhead, always-on sampling profilers. This sampling based profiler is exposed in our
malloc_extension.h. -
A SIGPROF-based CPU Profiler: The Linux
perftool is decreasing our internal need for signal-based profiling. Additionally, with restartable sequences, signals interrupt the fastpath, leading to skew between the observed instruction pointer and where we actually spend CPU time. -
A Heap Checker/Debug Allocator: The LeakSanitizer, AddressSanitizer, and MemorySanitizer suite provide higher accuracy and better performance.
-
A perl-based
pproftool: This project is now developed in Go and is available on Github.
Differences From Google’s Implementation of TCMalloc
The configuration on Github mirrors our production defaults, with two notable exceptions:
-
Many of our production servers start a background thread (via
tcmalloc::MallocExtension::ProcessBackgroundActions) to regularly calltcmalloc::MallocExtension::ReleaseMemoryToSystem, while others never release memory in favor of better CPU performance. These tradeoffs are discussed in ourtuning page. -
We do not activate GWP ASan by default, but can be activated via
MallocExtension.
Over time, we have found that configurability carries a maintenance burden. While a knob can provide immediate flexibility, the increased complexity can cause subtle problems for more rarely used combinations.
单独构建 tcmalloc
cd ~/github
git clone https://github.com/google/tcmalloc.git
cd tcmalloc
CC=clang bazel test //tcmalloc/...
编译构建输出:
WARNING: Ignoring JAVA_HOME, because it must point to a JDK, not a JRE.
WARNING: Running Bazel server needs to be killed, because the startup options are different.
Starting local Bazel server and connecting to it...
INFO: Analyzed 394 targets (83 packages loaded, 3102 targets configured).
INFO: Found 143 targets and 251 test targets...
INFO: Elapsed time: 310.730s, Critical Path: 175.06s
INFO: 4009 processes: 1798 internal, 2211 processwrapper-sandbox.
INFO: Build completed successfully, 4009 total actions
//tcmalloc:arena_test                                                    PASSED in 0.2s
//tcmalloc:central_freelist_test                                         PASSED in 45.0s
...

//tcmalloc/testing:threadcachesize_test_small_but_slow                   PASSED in 6.1s
//tcmalloc:profile_test                                                  PASSED in 86.3s
  Stats over 2 runs: max = 86.3s, min = 49.4s, avg = 67.9s, dev = 18.5s
//tcmalloc:transfer_cache_test                                           PASSED in 25.8s
  Stats over 3 runs: max = 25.8s, min = 10.7s, avg = 18.0s, dev = 6.2s

Executed 251 out of 251 tests: 251 tests pass.
INFO: Build completed successfully, 4009 total actions
Congratulations! You’ve installed TCMalloc
通过构建 gperftools 得到 tcmalloc
实际使用 tcmalloc 可以通过安装 gperftools 工具会包含 tcmalloc 库。
禁用 libunwind:
./configure --prefix=/data/home/gerryyang/tools/gperf/gperftools-2.10-install-gcc485 --enable-frame-pointers
使用 libunwind:
LDFLAGS="-L/data/home/gerryyang/tools/libunwind/libunwind-1.5.0-install-gcc485/lib" CPPFLAGS="-I/data/home/gerryyang/tools/libunwind/libunwind-1.5.0-install-gcc485/include" ./configure --prefix=/data/home/gerryyang/tools/gperf/gperftools-2.10-install-gcc485 --enable-libunwind
构建方法优化
可能需要考虑以下几点来优化构建过程:
- 优化编译选项:为了在生产环境中获得最佳性能,可以使用高优化级别编译 tcmalloc。例如,可以使用 -O3 优化级别。要设置编译选项,可以在构建命令中添加 CFLAGS 和 CXXFLAGS:
CFLAGS="-O3" CXXFLAGS="-O3" ./configure --prefix=/data/home/gerryyang/tools/gperf/gperftools-2.10-install-gcc485 --enable-frame-pointers
-
禁用不必要的功能:在生产环境中,你可能不需要 tcmalloc 的一些诊断功能,如内存泄漏检测、CPU 分析器和堆分析器。确保在构建命令中不包含这些功能的启用选项。在 gperftools 的构建过程中,默认情况下是不启用 CPU 分析器、堆分析器、堆检查器和 debugalloc 的。因此,通常情况下,不需要显式地添加这些禁用选项。
-
适应目标平台:确保使用与生产环境相匹配的编译器和库版本构建 tcmalloc。这有助于确保二进制文件在目标平台上的兼容性和性能。
-
测试:在将 tcmalloc 部署到生产环境之前,务必在类似的测试环境中进行充分的测试。这包括性能测试、压力测试和功能测试。这有助于确保在生产环境中没有意外的问题。
综上所述,可以使用以下命令进行构建:
CFLAGS="-O3" CXXFLAGS="-O3" ./configure --prefix=/data/home/gerryyang/tools/gperf/gperftools-2.10-install-gcc485 --enable-frame-pointers --disable-cpu-profiler --disable-heap-profiler --disable-heap-checker --disable-debugalloc
在构建 gperftools 以用于生产环境时,除了前面提到的选项外,还可以考虑以下选项:
-
–enable-minimal:这个选项可以用于构建一个最小功能的 tcmalloc 库,去除了 CPU 分析器、堆分析器和内存泄漏检测器。这可以减小库的大小并提高性能。请注意,这个选项会覆盖前面提到的 –disable-cpu-profiler、–disable-heap-profiler 和 –disable-heap-checker 选项。
-
–enable-shared 和 –disable-static:这两个选项可以用于构建共享库(.so 文件)而不是静态库(.a 文件)。在某些情况下,使用共享库可能有助于减小可执行文件的大小并提高加载速度。但请注意,使用共享库可能会导致部署和兼容性问题。
-
–with-pic:这个选项用于构建位置无关代码(PIC)。如果你计划将 tcmalloc 作为共享库链接到其他程序中,这个选项可能是必需的。
-
–enable-libunwind:如果你想使用 libunwind 来获取更准确和更快速的堆栈回溯,可以启用此选项。但请注意,这可能会导致与其他库的冲突和兼容性问题。在启用此选项之前,请确保在你的环境中进行了充分的测试。
综上所述,你可以根据需要组合这些选项。例如,一个用于生产环境的完整构建命令可能如下所示:
动态库:
CFLAGS="-O3" CXXFLAGS="-O3" ./configure --prefix=/data/home/gerryyang/tools/gperf/gperftools-2.10-install-gcc485 --enable-frame-pointers --disable-cpu-profiler --disable-heap-profiler --disable-heap-checker --disable-debugalloc --enable-minimal --enable-shared --disable-static --with-pic
静态库:
CFLAGS="-O3" CXXFLAGS="-O3" ./configure --prefix=/data/home/gerryyang/tools/gperf/gperftools-2.10-install-gcc485 --enable-frame-pointers --disable-cpu-profiler --disable-heap-profiler --disable-heap-checker --disable-debugalloc --enable-minimal --with-pic
完整的功能:
CFLAGS="-O3" CXXFLAGS="-O3" ./configure --prefix=/data/home/gerryyang/tools/gperf/gperftools-2.10-install-gcc485 --enable-frame-pointers --with-pic
64-BIT LINUX Issue (死锁问题)
NOTE FOR 64-BIT LINUX SYSTEMS

The glibc built-in stack-unwinder on 64-bit systems has some problems
with the perftools libraries.  (In particular, the cpu/heap profiler
may be in the middle of malloc, holding some malloc-related locks when
they invoke the stack unwinder.  The built-in stack unwinder may call
malloc recursively, which may require the thread to acquire a lock it
already holds: deadlock.)
可能的解决方法:
If you encounter problems, try compiling perftools with './configure
--enable-frame-pointers'.  Note you will need to compile your
application with frame pointers (via 'gcc -fno-omit-frame-pointer
...') in this case.
参考:https://github.com/gperftools/gperftools/blob/gperftools-2.10/INSTALL 其中 NOTE FOR 64-BIT LINUX SYSTEMS 部署说明。
Running the TCMalloc Hello World
Once you’ve verified you have TCMalloc installed correctly, you can compile and run the tcmalloc-hello sample binary to see how TCMalloc is linked into a sample binary. This tiny project features proper configuration and a simple hello_main to demonstrate how TCMalloc works.
#include <iostream>
#include <memory>
#include <string>

#include "absl/strings/str_cat.h"
#include "absl/strings/str_format.h"
#include "absl/types/optional.h"
#include "tcmalloc/malloc_extension.h"

int main(int argc, char** argv) {
  std::string msg = absl::StrCat("hello ", argc < 2 ? "world" : argv[1], "!");

  absl::optional<size_t> heap_size =
      tcmalloc::MallocExtension::GetNumericProperty(
          "generic.current_allocated_bytes");
  if (heap_size.has_value()) {
    std::cout << "Current heap size = " << *heap_size << " bytes" << std::endl;
  }

  std::cout << msg << std::endl;

  // Allocate memory, printing the pointer to deter an optimizing compiler from
  // eliding the allocation. (防止编译器优化)
  constexpr size_t kSize = 1024 * 1024 * 1024;
  std::unique_ptr<char[]> ptr(new char[kSize]); // 动态内存分配

  std::cout << absl::StreamFormat("new'd %d bytes at %p\n", kSize, ptr.get());

  heap_size = tcmalloc::MallocExtension::GetNumericProperty(
      "generic.current_allocated_bytes");
  if (heap_size.has_value()) {
    std::cout << "Current heap size = " << *heap_size << " bytes" << std::endl;
  }

  void* ptr2 = malloc(kSize); // 动态内存分配
  std::cout << absl::StreamFormat("malloc'd %d bytes at %p\n", kSize, ptr2);

  heap_size = tcmalloc::MallocExtension::GetNumericProperty(
      "generic.current_allocated_bytes");
  if (heap_size.has_value()) {
    std::cout << "Current heap size = " << *heap_size << " bytes" << std::endl;
  }

  free(ptr2);
}
First, build the tcmalloc/testing:hello_main target:
~/github/tcmalloc$CC=clang bazel build tcmalloc/testing:hello_main
WARNING: Ignoring JAVA_HOME, because it must point to a JDK, not a JRE.
INFO: Analyzed target //tcmalloc/testing:hello_main (1 packages loaded, 114 targets configured).
INFO: Found 1 target...
Target //tcmalloc/testing:hello_main up-to-date:
  bazel-bin/tcmalloc/testing/hello_main
INFO: Elapsed time: 10.843s, Critical Path: 6.07s
INFO: 87 processes: 2 internal, 85 processwrapper-sandbox.
INFO: Build completed successfully, 87 total actions
Now, run the compiled program:
~/github/tcmalloc$CC=clang bazel run tcmalloc/testing:hello_main
WARNING: Ignoring JAVA_HOME, because it must point to a JDK, not a JRE.
INFO: Analyzed target //tcmalloc/testing:hello_main (1 packages loaded, 114 targets configured).
INFO: Found 1 target...
Target //tcmalloc/testing:hello_main up-to-date:
  bazel-bin/tcmalloc/testing/hello_main
INFO: Elapsed time: 6.460s, Critical Path: 3.23s
INFO: 50 processes: 2 internal, 48 processwrapper-sandbox.
INFO: Build completed successfully, 50 total actions
INFO: Build completed successfully, 50 total actions
Current heap size = 73728 bytes
hello world!
new'd 1073741824 bytes at 0x463880000000
Current heap size = 1073816576 bytes
malloc'd 1073741824 bytes at 0x4638c0000000
Current heap size = 2147558400 bytes
You can inspect this code within tcmalloc/testing/hello_main.cc
Creating and Running TCMalloc
Now that you’ve obtained the TCMalloc code and verified that you can build, test, and run it, you’re ready to use it within your own project.
Linking Your Code to the TCMalloc Repository
Adding Abseil
TCMalloc requires Abseil which you will also need to provide as a local_repository, or link to a specific commit (we always recommend the latest commit) using an http_archive declaration in the WORKSPACE file:
Creating Your Test Code
Creating Your BUILD File
Congratulations! You’ve created your first binary using TCMalloc.
TCMalloc : Thread-Caching Malloc
TCMalloc is a memory allocator designed as an alternative to the system default allocator that has the following characteristics:
- Fast, uncontended allocation and deallocation for most objects. Objects are cached, depending on mode, either per-thread, or per-logical-CPU. Most allocations do not need to take locks, so there is low contention and good scaling for multi-threaded applications.
- Flexible use of memory, so freed memory can be reused for different object sizes, or returned to the OS.
- Low per object memory overhead by allocating “pages” of objects of the same size. Leading to space-efficient representation of small objects.
- Low overhead sampling, enabling detailed insight into applications memory usage.
The following block diagram shows the rough internal structure of TCMalloc:
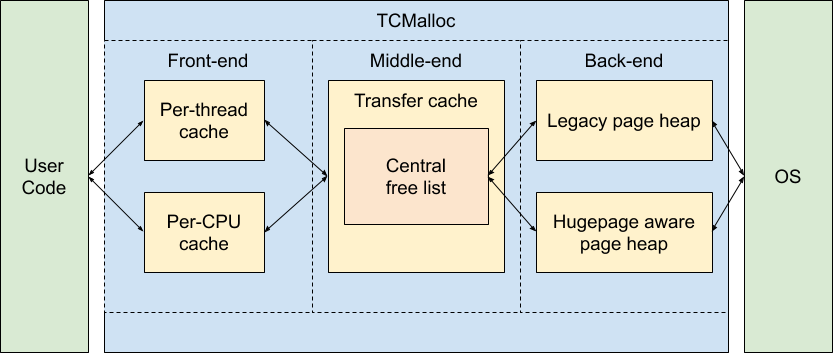
We can break TCMalloc into three components. The front-end, middle-end, and back-end. We will discuss these in more details in the following sections. A rough breakdown of responsibilities is:
- The front-end is a cache that provides fast allocation and deallocation of memory to the application.
- The middle-end is responsible for refilling the front-end cache.
- The back-end handles fetching memory from the OS.
Note that the front-end can be run in either per-CPU or legacy per-thread mode, and the back-end can support either the hugepage aware pageheap or the legacy pageheap.
See more: https://github.com/google/tcmalloc/blob/master/docs/design.md
分配原理
定长分配 (使用 freelist 进行对象分配)
假设 Page 的内存大小为 4KB,需要以 16 字节为单位进行分配。通过 freelist 的方式,将 4KB 划分为 16 字节的 Object,每个单元的前 8 个字节作为节点的指针,指向下一个单元。分配时,从链表头分配一个 Object 出去,释放时,将 Object 再插入到链表中。
变长分配
扩展为多种定长分配的方式。
把所有的变长记录进行“取整”,例如分配 7 字节,就分配 8 字节,31 字节分配 32 字节,得到多种规格的定长记录。这里带来了内部内存碎片的问题,即分配出去的空间不会被完全利用,有一定浪费。为了减少内部碎片,分配规则按照 8, 16, 32, 48, 64, 80 这样子来。注意到,这里并不是简单地使用 2 的幂级数,因为按照 2 的幂级数,内存碎片会相当严重,分配 65 字节,实际会分配 128 字节,接近 50% 的内存碎片。而按照这里的分配规格,只会分配 80 字节,一定程度上减轻了问题。
大对象的分配
多个连续的 Page 会组成一个 Span,在 Span 中记录起始 Page 的编号,以及 Page 的数量。分配对象时,小的对象从 Span 分配,大的对象直接分配 Span。(分级的思想)
Span 的管理
使用类似的方案,用多种定长 Page 来实现变长 Page 的分配。
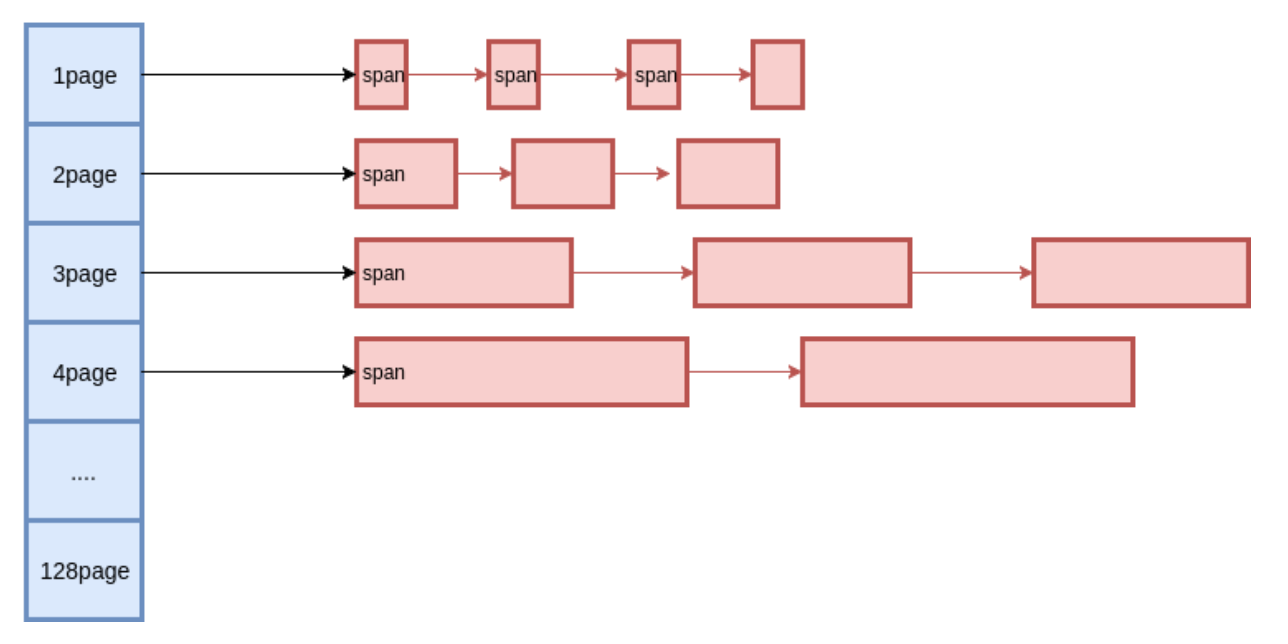
Span 到 Page 的映射:由于 Span 中记录了起始的 Page,因而就知道了从 Span 到 Page 的映射。 Page 到 Span 的映射:使用 RadixTree 来实现 PageMap,记录 Page 所属的 Span。
从而,通过伙伴系统,实现 Span 的分裂与合并。
全局对象分配
有了基于 Page 的对象分配,以及 Page 的管理,从而可以得到一个简单的内存分配器了。
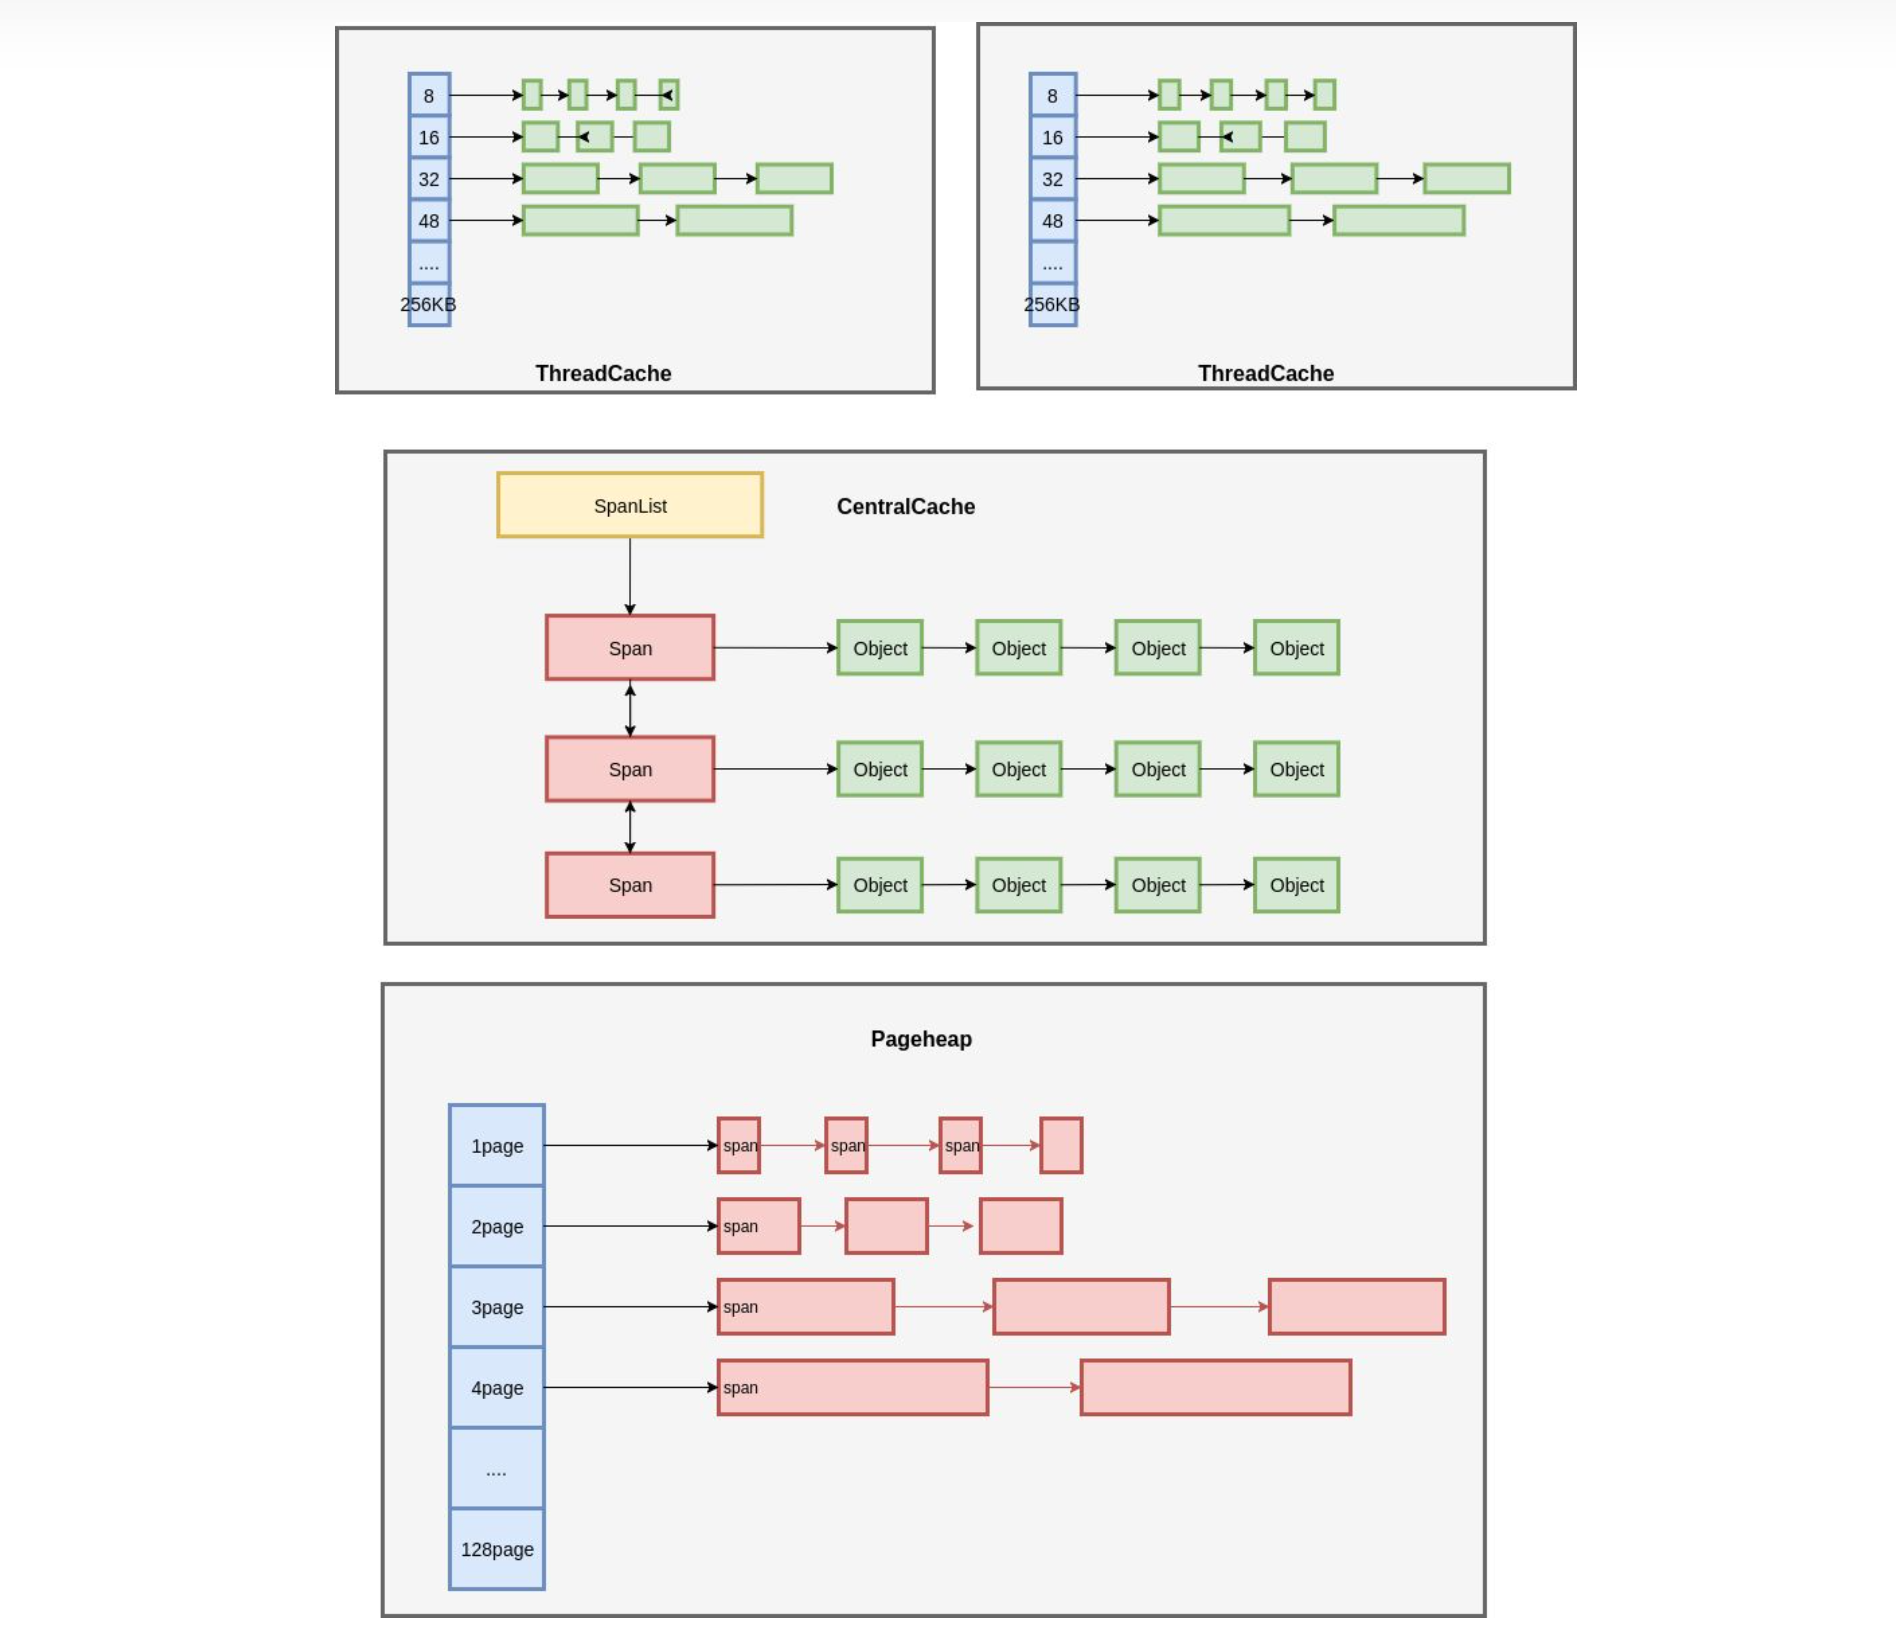
每种规格的对象,都有一个独立的内存分配单元 CentralCache。通过链表把所有 Span 组织起来,每次需要分配时,就找一个 Span 从中分配一个 Object。当没有空闲的 Span 时,就从 PageHeap 申请 Span。
但是,当在多线程场景下,所有线程都从 CentralCache 分配,竞争比较激烈。
ThreadCache
每一个线程有一个 ThreadCache。ThreadCache 从 CentralCache 批量申请和释放内存。
每个线程持有一个线程局部的 ThreadCache,按照不同的对象规格,维护了对象的链表。如果 ThreadCache 的对象不够了,就从 CentralCache 批量分配;如果 CentralCache 依然没有,就从 PageHeap 申请 Span;如果 PageHeap 也没有合适的 Page,就只能从操作系统申请了。
在释放内存的时候,采用相反的顺序。ThreadCache 遵循批量释放的策略,当对象积累到一定程度时释放给 CentralCache;当 CentralCache 发现一个 Span 的内存完全释放了,就把这个 Span 归还给 PageHeap;当 PageHeap 发现一批连续的 Page 都释放了,就归还给操作系统。
Understanding Malloc Stats
Human-readable statistics can be obtained by calling tcmalloc::MallocExtension::GetStats().
The output contains a lot of information. Much of it can be considered debug info that’s interesting to folks who are passingly familiar with the internals of TCMalloc, but potentially not that useful for most people.
Summary Section
The most generally useful section is the first few lines:
See https://github.com/google/tcmalloc/tree/master/docs/stats.md for an explanation of this page
------------------------------------------------
MALLOC:    10858234672 (10355.2 MiB) Bytes in use by application
MALLOC: +    827129856 (  788.8 MiB) Bytes in page heap freelist
MALLOC: +    386098400 (  368.2 MiB) Bytes in central cache freelist
MALLOC: +    105330688 (  100.5 MiB) Bytes in per-CPU cache freelist
MALLOC: +      9095680 (    8.7 MiB) Bytes in transfer cache freelist
MALLOC: +       660976 (    0.6 MiB) Bytes in thread cache freelists
MALLOC: +     49333930 (   47.0 MiB) Bytes in malloc metadata
MALLOC: +       629440 (    0.6 MiB) Bytes in malloc metadata Arena unallocated
MALLOC: +      1599704 (    1.5 MiB) Bytes in malloc metadata Arena unavailable
MALLOC:   ------------
MALLOC: =  12238113346 (11671.2 MiB) Actual memory used (physical + swap)
MALLOC: +    704643072 (  672.0 MiB) Bytes released to OS (aka unmapped)
MALLOC:   ------------
MALLOC: =  12942756418 (12343.2 MiB) Virtual address space used
- Bytes in use by application: Number of bytes that the application is actively using to hold data. This is computed by the bytes requested from the OS minus any bytes that are held in caches and other internal data structures.
- Bytes in page heap freelist: The pageheap is a structure that holds memory ready for TCMalloc to use. This memory is not actively being used, and could be returned to the OS. See TCMalloc tuning
- Bytes in central cache freelist: This is the amount of memory currently held in the central freelist. This is a structure that holds partially used “spans” of memory. The spans are partially used because some memory has been allocated from them, but not entirely used - since they have some free memory on them.
- Bytes in per-CPU cache freelist: In per-cpu mode (which is the default) each CPU holds some memory ready to quickly hand to the application. The maximum size of this per-cpu cache is tunable. See TCMalloc tuning
- Bytes in transfer cache freelist: The transfer cache can be considered another part of the central freelist. It holds memory that is ready to be provided to the application for use.
- Bytes in thread cache freelists: The TC in TCMalloc stands for thread cache. Originally each thread held its own cache of memory to provide to the application. Since the change of default to per-cpu caches, the thread caches are used by very few applications. However, TCMalloc starts in per-thread mode, so there may be some memory left in per-thread caches from before it switches into per-cpu mode.
- Bytes in malloc metadata: the size of the data structures used for tracking memory allocation. This will grow as the amount of memory used grows.
- Bytes in malloc metadata Arena unallocated: Metadata is allocated in an internal Arena. Memory requests to the OS are made in blocks which amortize several Arena allocations and this captures memory that is not yet allocated but could be by future Arena allocations.
- Bytes in malloc metadata Arena unavailable: The Arena allocator may fail to allocate a block fully when a subsequent Arena allocation request is made that is larger than the block’s remaining space. This memory is currently unavailable for allocation.
There’s a couple of summary lines:
- Actual memory used: This is the total amount of memory that TCMalloc thinks it is using in the various categories. This is computed from the size of the various areas, the actual contribution to RSS may be larger or smaller than this value. The true RSS may be less if memory is not mapped in. In some cases RSS can be larger if small regions end up being mapped with huge pages. This does not count memory that TCMalloc is not aware of (eg memory mapped files, text segments etc.)
- Bytes released to OS: TCMalloc can release memory back to the OS (see tcmalloc tuning), and this is the upper bound on the amount of released memory. However, it is up to the OS as to whether the act of releasing the memory actually reduces the RSS of the application. The code uses MADV_DONTNEED/MADV_REMOVE which tells the OS that the memory is no longer needed.
- Virtual address space used: This is the amount of virtual address space that TCMalloc believes it is using. This should match the later section on requested memory. There are other ways that an application can increase its virtual address space, and this statistic does not capture them.
More Detail On Metadata
The next section gives some insight into the amount of metadata that TCMalloc is using. This is really debug information, and not very actionable.
MALLOC:         236176               Spans in use
MALLOC:         238709 (   10.9 MiB) Spans created
MALLOC:              8               Thread heaps in use
MALLOC:             46 (    0.0 MiB) Thread heaps created
MALLOC:          13517               Stack traces in use
MALLOC:          13742 (    7.2 MiB) Stack traces created
MALLOC:              0               Table buckets in use
MALLOC:           2808 (    0.0 MiB) Table buckets created
MALLOC:       11665416 (   11.1 MiB) Pagemap bytes used
MALLOC:        4067336 (    3.9 MiB) Pagemap root resident bytes
- Spans: structures that hold multiple pages of allocatable objects.
- Thread heaps: These are the per-thread structures used in per-thread mode.
- Stack traces: These hold metadata for each sampled object.
- Table buckets: These hold data for stack traces for sampled events.
- Pagemap: This data structure supports the mapping of object addresses to information about the objects held on the page. The pagemap root is a potentially large array, and it is useful to know how much of it is actually memory resident.
See more: https://github.com/google/tcmalloc/blob/master/docs/stats.md
测试代码
#include <iostream>
#include <chrono>
#include <cstdlib>
#include <ctime>
#include <vector>

const int kNumAllocations = 1000000;

void test_memory_allocation(int allocation_size) {
    std::vector<void*> allocated_memory;
    allocated_memory.reserve(kNumAllocations);

    auto start = std::chrono::high_resolution_clock::now();

    for (int i = 0; i < kNumAllocations; ++i) {
            void* ptr = malloc(allocation_size);
            if (ptr == nullptr) {
                    std::cerr << "Memory allocation failed" << std::endl;
                    exit(1);
            }
            allocated_memory.push_back(ptr);
    }

    for (void* ptr : allocated_memory) {
            free(ptr);
    }

    auto end = std::chrono::high_resolution_clock::now();
    auto duration = std::chrono::duration_cast<std::chrono::milliseconds>(end - start).count();

    std::cout << "Allocation size: " << allocation_size << " bytes, "
            << "Total allocations: " << kNumAllocations << ", "
            << "Duration: " << duration << " ms" << std::endl;
}

int main() {
    test_memory_allocation(16);
    test_memory_allocation(64);
    test_memory_allocation(256);
    test_memory_allocation(1024);
    test_memory_allocation(4096);
    test_memory_allocation(1572864);
    test_memory_allocation(2044723);

    return 0;
}
输出结果:
Allocation size: 16 bytes, Total allocations: 1000000, Duration: 20 ms
Allocation size: 64 bytes, Total allocations: 1000000, Duration: 32 ms
Allocation size: 256 bytes, Total allocations: 1000000, Duration: 80 ms
Allocation size: 1024 bytes, Total allocations: 1000000, Duration: 251 ms
Allocation size: 4096 bytes, Total allocations: 1000000, Duration: 847 ms
Allocation size: 1572864 bytes, Total allocations: 1000000, Duration: 4757 ms
Allocation size: 2044723 bytes, Total allocations: 1000000, Duration: 2199 ms
The libunwind project
The primary goal of this project is to define a portable and efficient C programming interface (API) to determine the call-chain of a program. The API additionally provides the means to manipulate the preserved (callee-saved) state of each call-frame and to resume execution at any point in the call-chain (non-local goto). The API supports both local (same-process) and remote (across-process) operation. As such, the API is useful in a number of applications. Some examples include:
下载地址:https://www.nongnu.org/libunwind/download.html
通过 LD_PRELOAD 使用 tcmalloc
使用 LD_PRELOAD 运行程序:在运行程序时,设置 LD_PRELOAD 环境变量以加载 libtcmalloc.so
LD_PRELOAD=/path/to/libtcmalloc.so your_program
检查进程映射:在程序运行时,可以使用 /proc 文件系统检查已加载的共享库。首先,找到程序的进程ID(PID),然后查看 /proc/PID/maps 文件。例如,如果程序的 PID 为 12345,则运行以下命令:
cat /proc/12345/maps
在输出的结果中,检查 libtcmalloc.so 的路径。如果找到了该路径,说明 libtcmalloc.so 已成功加载。
或者:
lsof -p 12345 | grep libtcmalloc.so

pmap 12345 | grep libtcmalloc.so
Performance Tuning TCMalloc
User-Accessible Controls
There are three user accessible controls that we can use to performance tune TCMalloc:
- The logical page size for TCMalloc (
4KiB,8KiB,32KiB,256KiB) - The per-thread or per-cpu cache sizes
- The rate at which memory is released to the OS
None of these tuning parameters are clear wins, otherwise they would be the default. We’ll discuss the advantages and disadvantages of changing them.
The Logical Page Size for TCMalloc (逻辑页大小)
This is determined at compile time by linking in the appropriate version of TCMalloc. The page size indicates the unit in which TCMalloc manages memory. The default is in 8KiB chunks, there are larger options of 32KiB and 256KiB. There is also the 4KiB page size used by the small-but-slow allocator.
- 编译时确定:TCMalloc 的逻辑页大小在编译时通过链接不同版本的库决定。
- 内存管理单元:该页大小是 TCMalloc 管理内存的基本单位。
- 可选值:
- 默认值:8 KiB
- 其他选项:32 KiB、256 KiB
- 特殊选项:4 KiB(由
small-but-slow分配器使用)
A smaller page size allows TCMalloc to provide memory to an application with less waste. Waste comes about through two issues:
- Left-over memory when rounding larger requests to the page size (eg a request for
62 KiBmight get rounded to64 KiB). - Pages of memory that are stuck because they have a single in use allocation on the page, and therefore cannot be repurposed to hold a different size of allocation.
小页大小的优势(减少内存浪费)
小页(如 4KiB/8KiB)通过两种方式降低内存浪费:
- 分配舍入浪费
- 若申请内存非整页倍数,TCMalloc 会向上取整到页大小。
- 示例:申请
62 KiB可能被舍入到64 KiB(使用8 KiB页时),浪费2 KiB。
- 碎片化导致的页面滞留
- 每个页仅存放同尺寸的小对象(例如专用于 512 字节对象的页)。
- 只有当页内所有对象均被释放时,该页才能被重新用于其他尺寸的对象。
- 小页 vs 大页的影响:大页更容易因少量存活对象导致整页无法复用,增加内存占用。
| 页大小 | 单个页容纳 512B 对象数 | 全部释放概率 | 页面滞留风险 |
|---|---|---|---|
| 4 KiB | 8 个 | 较高 | 低 |
| 256 KiB | 512 个 | 极低 | 高 |
大页大小的优势(性能优化)
- 内存局部性与大页映射
- 优势:
- 大页减少 TLB 压力:若系统支持大页(HugePages),大页配置可减少 TLB(地址转换缓存)条目占用,加速内存访问。
- 提升缓存局部性:同尺寸对象在物理内存中更紧凑,提高 CPU 缓存效率。
- 优势:
- PageMap 查询效率
- PageMap:TCMalloc 用于记录内存分配状态的核心数据结构。
- 大页优势:
- 相同内存量下,大页需更少的 PageMap 条目。
- PageMap 体积更小,更容易驻留 CPU 缓存,加速查询。
- 注意:现代 TCMalloc 的
sized delete特性减少了 PageMap 查询次数,削弱了大页在此方面的优势。
实践建议
| 页大小 | 适用场景 | 注意事项 |
|---|---|---|
| 8 KiB | 默认值,适合大多数应用 | 平衡内存效率与性能 |
| 32/256 KiB | 堆内存达 GiB 级别的大型应用 | 需实测性能/内存占用的收益 |
| 4 KiB (small-but-slow) | 极端内存敏感场景 | 性能代价极高,尽量避免使用 |
关于 small-but-slow:
- 机制:关闭 TCMalloc 的多级缓存,减少内存开销。
- 代价:分配/释放操作变慢,性能显著下降。
- 建议:仅当内存资源极度受限且性能无关紧要时使用。
Per-thread/per-cpu Cache Sizes
The default is for TCMalloc to run in per-cpu mode as this is faster; however, there are few applications which have not yet transitioned. The plan is to move these across at some point soon.
- Per-Thread
- 每个线程独立缓存,存在跨线程内存迁移开销
- Per-CPU
- 绑定 CPU 核,利用处理器亲和性减少锁竞争,性能更高(默认启用)
- 现代 CPU 多核架构下,Per-CPU 缓存通过 NUMA 亲和性 避免跨核锁争用,分配释放路径更短。
Increasing the size of the cache is an obvious way to improve performance. The larger the cache the less frequently memory needs to be fetched from the central caches. Returning memory from the cache is substantially faster than fetching from the central cache.
The size of the per-cpu caches is controlled by tcmalloc::MallocExtension::SetMaxPerCpuCacheSize. This controls the limit for each CPU, so the total amount of memory for application could be much larger than this. Memory on CPUs where the application is no longer able to run can be freed by calling tcmalloc::MallocExtension::ReleaseCpuMemory.
缓存大小控制 API:
// 设置单个 CPU 核的缓存上限(单位:字节)
tcmalloc::MallocExtension::SetMaxPerCpuCacheSize(size_t size);

// 释放闲置 CPU 核占用的缓存(如容器调度后残留内存)
tcmalloc::MallocExtension::ReleaseCpuMemory(int cpu);
The heterogeneous per-cpu cache optimization in TCMalloc dynamically sizes per-cpu caches so as to balance the miss rate across all the active and populated caches. It shuffles and reassigns the capacity from lightly used caches to the heavily used caches, using miss rate as the proxy for their usage. The heavily used per-cpu caches may steal capacity from lightly used caches and grow beyond the limit set by tcmalloc_max_per_cpu_cache_size flag.
Releasing memory held by unuable CPU caches is handled by tcmalloc::MallocExtension::ProcessBackgroundActions.
后台自动回收:
// 触发后台回收(定期自动调用,无需手动执行)
tcmalloc::MallocExtension::ProcessBackgroundActions();
In contrast tcmalloc::MallocExtension::SetMaxTotalThreadCacheBytes controls the total size of all thread caches in the application.
// 设置所有线程缓存的总大小上限(单位:字节)
tcmalloc::MallocExtension::SetMaxTotalThreadCacheBytes(size_t size);
- 与 Per-CPU 区别:此 API 仅影响旧版 Per-Thread 模式,对 Per-CPU 无效。
- 设计逻辑:线程间无法共享缓存,需限制全局总量防内存膨胀。
Suggestion: The default cache size is typically sufficient, but cache size can be increased (or decreased) depending on the amount of time spent in TCMalloc code, and depending on the overall size of the application (a larger application can afford to cache more memory without noticeably increasing its overall size).
增大缓存的收益与代价:
| 方向 | 优点 | 风险 |
|---|---|---|
| 增大缓存 | ✅ 减少访问中央缓存的频率,加速分配/释放 | ❌ 总内存占用上升 |
| 减小缓存 | ✅ 降低应用内存基线 | ❌ 频繁访问中央缓存导致锁竞争 |
调优建议:
- 默认值适用大多数场景。TCMalloc 的默认缓存大小经过广泛验证,无需主动调整。
- 需要调优的指标
- 监控
tcmalloc.cpu_cache.total_used_bytes,观察实际缓存用量 - 分析性能剖析数据,若 TCMalloc_Internal 类函数消耗 >5% CPU 时间,说明缓存不足
- 监控
- 扩容缓存的条件
if (应用内存 > 1GiB and TCMalloc CPU耗时占比高) or (突发高频分配场景):
    适当增加 MaxPerCpuCacheSize  # 建议每次增加 25%
- 缩容缓存的条件
if (内存敏感型应用) and (监控显示缓存利用率 < 60%):
    逐步减小 MaxPerCpuCacheSize  # 优先尝试降低 15-20%
动态调节的底层逻辑:缓存命中 vs 内存开销的博弈,TCMalloc 在以下两者间动态平衡:
- 时间局部性:缓存越大,重复分配模式越高效。
- 空间成本:缓存膨胀削减应用可用内存。
建议:
- 优先信任默认值,除非有明确性能瓶颈证据
- Per-CPU 模式是未来方向,新项目无需考虑线程缓存
- 调参后必须进行 A/B 压测(推荐 pprof 分析内存/CPU 变化)
Memory Releasing
tcmalloc::MallocExtension::ReleaseMemoryToSystem makes a request to release n bytes of memory to TCMalloc. This can keep the memory footprint of the application down to a minimal amount, however it should be considered that this just reduces the application down from its peak memory footprint over time, and does not make that peak memory footprint smaller.
主动释放内存 API:
// 请求 TCMalloc 向操作系统释放指定字节数的内存
tcmalloc::MallocExtension::ReleaseMemoryToSystem(size_t n);
- 核心作用:强制降低应用的当前内存占用
- 关键限制:
- 只能释放空闲内存(已分配内存不受影响)
- 无法降低历史峰值内存(如突发负载产生的内存尖刺)
- 释放后若立即需要内存,会触发高成本的缺页中断
代价:缺页中断耗时 ≈ 微秒级(比正常分配慢 100-1000 倍)
Using a background thread running tcmalloc::MallocExtension::ProcessBackgroundActions(), memory will be released from the page heap at the specified rate.
后台自动释放机制:
// 后台线程定期执行内存回收(默认启用)
tcmalloc::MallocExtension::ProcessBackgroundActions();
| 内存池 | 是否可释放 | 说明 |
|---|---|---|
| PageHeap(大内存池) | ✅ | 主要释放来源 |
| Stranded per-CPU 缓存 | ✅ | 闲置 CPU 核的缓存 |
| CentralFreeList | ❌ | 中央缓存不可释放 |
| 活跃 per-CPU 缓存 | ❌ | 正在使用的 CPU 核缓存 |
There are two disadvantages of releasing memory aggressively:
- Memory that is unmapped may be immediately needed, and there is a cost to faulting unmapped memory back into the application.
- Memory that is unmapped at small granularity will break up hugepages, and this will cause some performance loss due to increased TLB misses.
Note: Release rate is not a panacea for memory usage. Jobs should be provisioned for peak memory usage to avoid OOM errors. Setting a release rate may enable an application to exceed the memory limit for short periods of time without triggering an OOM. A release rate is also a good citizen behavior as it will enable the system to use spare capacity memory for applications which are are under provisioned. However, it is not a substitute for setting appropriate memory requirements for the job.
Note: Memory is released from the PageHeap and stranded per-cpu caches. It is not possible to release memory from other internal structures, like the CentralFreeList.
Suggestion: The default release rate is probably appropriate for most applications. In situations where it is tempting to set a faster rate it is worth considering why there are memory spikes, since those spikes are likely to cause an OOM at some point.
内存释放的三条铁律:
- 释放是事后补救:只能降低当前水位,不能削减历史峰值
- 释放有性能代价:在缺页中断和大页破碎间权衡
- 释放非防 OOM 手段:必须基于真实峰值配置内存资源
System-Level Optimizations
- TCMalloc heavily relies on Transparent Huge Pages (
THP). As of February 2020, we build and test with
/sys/kernel/mm/transparent_hugepage/enabled:
    [always] madvise never

/sys/kernel/mm/transparent_hugepage/defrag:
    always defer [defer+madvise] madvise never`

/sys/kernel/mm/transparent_hugepage/khugepaged/max_ptes_none:
    0
- TCMalloc makes assumptions about the availability of virtual address space, so that we can layout allocations in cetain ways. We build and test with
/proc/sys/vm/overcommit_memory:
    1
Build-Time Optimizations
TCMalloc is built and tested in certain ways. These build-time options can improve performance:
-
Statically-linking TCMalloc reduces function call overhead, by obviating the need to call procedure linkage stubs in the procedure linkage table (PLT).
-
Enabling sized deallocation from C++14 reduces deallocation costs when the size can be determined. Sized deallocation is enabled with the -fsized-deallocation flag. This behavior is enabled by default in GCC), but as of early 2020, is not enabled by default on Clang even when compiling for C++14/C++17.
Some standard C++ libraries (such as libc++) will take advantage of sized deallocation for their allocators as well, improving deallocation performance in C++ containers.
- Aligning raw storage allocated with
::operator newto 8 bytes by compiling with__STDCPP_DEFAULT_NEW_ALIGNMENT__ <= 8. This smaller alignment minimizes wasted memory for many common allocation sizes (24, 40, etc.) which are otherwise rounded up to a multiple of 16 bytes. On many compilers, this behavior is controlled by the-fnew-alignment=...flag.
When __STDCPP_DEFAULT_NEW_ALIGNMENT__ is not specified (or is larger than 8 bytes), we use standard 16 byte alignments for ::operator new. However, for allocations under 16 bytes, we may return an object with a lower alignment, as no object with a larger alignment requirement can be allocated in the space.
- Optimizing failures of
operator newby directly failing instead of throwing exceptions. Because TCMalloc does not throw exceptions whenoperator newfails, this can be used as a performance optimization for many move constructors.
Within Abseil code, these direct allocation failures are enabled with the Abseil build-time configuration macro ABSL_ALLOCATOR_NOTHROW.
Benchmark
Q&A
tcmalloc::allocate_full_XXX
参考 gperftools 2.7,src/tcmalloc.cc 中 do_allocate_full 接口注释:
// tcmalloc::allocate_full_XXX is called by fast-path malloc when some
// complex handling is needed (such as fetching object from central
// freelist or malloc sampling). It contains all 'operator new' logic,
// as opposed to malloc_fast_path which only deals with important
// subset of cases.
//
// Note that this is under tcmalloc namespace so that pprof
// can automatically filter it out of growthz/heapz profiles.
//
// We have slightly fancy setup because we need to call hooks from
// function in 'google_malloc' section and we cannot place template
// into this section. Thus 3 separate functions 'built' by macros.
//
// Also note that we're carefully orchestrating for
// MallocHook::GetCallerStackTrace to work even if compiler isn't
// optimizing tail calls (e.g. -O0 is given). We still require
// ATTRIBUTE_ALWAYS_INLINE to work for that case, but it was seen to
// work for -O0 -fno-inline across both GCC and clang. I.e. in this
// case we'll get stack frame for tc_new, followed by stack frame for
// allocate_full_cpp_throw_oom, followed by hooks machinery and user
// code's stack frames. So GetCallerStackTrace will find 2
// subsequent stack frames in google_malloc section and correctly
// 'cut' stack trace just before tc_new.
这段注释解释了tcmalloc库中allocate_full_XXX函数的用途和实现细节。这些函数在内存分配的快速路径(fast-path)无法处理的复杂情况下被调用。以下是对这段注释的逐句解释:
tcmalloc::allocate_full_XXX在需要处理复杂情况(如从中央空闲列表获取对象或内存分配采样)时被快速路径内存分配调用。它包含了所有operator new的逻辑,而malloc_fast_path只处理重要的子集情况。
这句话说明allocate_full_XXX函数在快速路径无法处理的情况下被调用,例如从中央空闲列表获取对象或进行内存分配采样。它包含了所有与C++的operator new相关的逻辑。
- 请注意,这是在tcmalloc命名空间下,以便
pprof可以自动从growthz/heapz配置文件中过滤掉。
这句话说明这些函数位于tcmalloc命名空间中,这样pprof工具可以自动地从growthz和heapz分析结果中排除这些函数。
- 我们有一个稍微复杂的设置,因为我们需要从google_malloc部分的函数中调用钩子,而我们不能将模板放入此部分。因此,由宏构建的3个独立函数。
这句话说明实现这些函数的方式略有不同,因为它们需要在google_malloc部分中调用钩子函数。为了实现这一目标,代码使用了宏来构建3个独立的函数。
- 另请注意,我们正在仔细安排
MallocHook::GetCallerStackTrace,以便即使编译器不优化尾调用(例如,给出-O0),它也可以正常工作。我们仍然需要ATTRIBUTE_ALWAYS_INLINE才能在这种情况下工作,但它在-O0 -fno-inline的GCC和Clang中都可以正常工作。也就是说,在这种情况下,我们将获得tc_new的堆栈帧,然后是allocate_full_cpp_throw_oom的堆栈帧,然后是钩子机制和用户代码的堆栈帧。因此,GetCallerStackTrace将在google_malloc部分找到两个连续的堆栈帧,并在tc_new之前正确地“切断”堆栈跟踪。
这句话说明,为了让MallocHook::GetCallerStackTrace在不同的编译优化级别下都能正常工作,代码中采用了一些策略。这些策略确保了在不同编译器和优化设置下,GetCallerStackTrace都能正确地获取堆栈跟踪信息。
使用 tcmalloc 分配 2044723 大内存的调用堆栈
#0  0x00007f368db70d04 in ?? () from /lib64/libgcc_s.so.1
#1  0x00007f368db71ff9 in _Unwind_Backtrace () from /lib64/libgcc_s.so.1
#2  0x000000000040bb3a in GetStackTrace_libgcc (result=<optimized out>, max_depth=<optimized out>, skip_count=<optimized out>) at src/stacktrace_libgcc-inl.h:100
#3  0x000000000040c1e4 in GetStackTrace (result=result@entry=0x1be80345780, max_depth=max_depth@entry=30, skip_count=skip_count@entry=3) at src/stacktrace.cc:294
#4  0x000000000040da2e in RecordGrowth (growth=2048000) at src/page_heap.cc:582
#5  tcmalloc::PageHeap::GrowHeap (this=this@entry=0x436960 <tcmalloc::Static::pageheap_>, n=n@entry=250) at src/page_heap.cc:608
#6  0x000000000040dcc3 in tcmalloc::PageHeap::New (this=0x436960 <tcmalloc::Static::pageheap_>, n=n@entry=250) at src/page_heap.cc:156
#7  0x0000000000403e25 in (anonymous namespace)::do_malloc_pages (heap=heap@entry=0x68bc40, size=size@entry=2044723) at src/tcmalloc.cc:1255
#8  0x0000000000420d0e in do_malloc (size=2044723) at src/tcmalloc.cc:1279
#9  do_allocate_full<tcmalloc::malloc_oom> (size=2044723) at src/tcmalloc.cc:1691
#10 tcmalloc::allocate_full_malloc_oom (size=2044723) at src/tcmalloc.cc:1707
#11 0x00000000004049ce in test_memory_allocation (allocation_size=2044723) at test.cc:16
#12 0x0000000000404bf3 in main () at test.cc:43
tcmalloc::allocate_full_cpp_throw_oom
通过查看机器资源物理内存使用并不高,可能是什么原因导致 tcmalloc 抛出 cpp_throw_oom 异常呢?
cpp_throw_oom异常表示内存分配失败,但这并不一定意味着物理内存已用尽。以下是一些可能导致内存分配失败的原因,即使物理内存使用并不高:
-
内存碎片:内存分配器可能无法找到足够大的连续内存块来满足分配请求,即使总的可用内存看似充足。这通常是由于内存碎片导致的。
-
虚拟内存限制:操作系统可能会限制每个进程可以使用的虚拟内存数量。如果进程达到了这个限制,尝试分配更多内存可能会失败,即使物理内存仍有剩余。
-
内存分配器限制:tcmalloc等内存分配器可能会在内部维护自己的内存池和限制。如果内存分配器达到了这些限制,分配请求可能会失败,即使物理内存仍有剩余。
-
操作系统限制:操作系统可能会限制用户空间应用程序可以使用的内存数量。这可能是由于安全策略、资源配额等原因。在这种情况下,内存分配可能会失败,即使物理内存仍有剩余。
要诊断cpp_throw_oom异常的根本原因,可以尝试以下方法:
- 检查操作系统的日志和错误消息,了解内存分配失败的原因。
- 使用内存分析工具(如pprof)分析应用程序的内存使用情况,检查内存碎片和内存泄漏等问题。
- 检查操作系统的资源限制和分配策略,确保应用程序有足够的虚拟内存和物理内存可用。
- 考虑使用tcmalloc或其他内存分配器的调试和分析功能,以了解内存分配失败的详细原因。
allocate_full_cpp_throw_oom是tcmalloc库内部使用的一个函数,它在内存分配失败时负责抛出一个C++异常。当使用tcmalloc进行内存分配,但无法找到足够的空闲内存时,它会调用这个函数。这个函数的主要目的是在遇到内存分配失败时提供一个处理策略,通过抛出C++异常来通知调用者。
在tcmalloc的源代码中,allocate_full_cpp_throw_oom函数的实现如下:
void TCMallocImplementation::allocate_full_cpp_throw_oom(size_t size) {
  if (IsCppThrowHandlerRegistered()) {
    GetCppThrowHandler()(size);
  } else {
    // No C++ throw handler registered, so just call the default one.
    DefaultCppThrowHandler(size);
  }
}
这个函数的工作方式如下:
- 首先检查是否已经注册了一个C++异常处理器。如果已经注册了一个处理器,函数会调用该处理器,并传入所请求的内存大小。
- 如果没有注册处理器,函数会调用默认的C++异常处理器
DefaultCppThrowHandler。
DefaultCppThrowHandler函数的实现如下:
ABSL_ATTRIBUTE_NORETURN void DefaultCppThrowHandler(size_t size) {
  // Check if we should call the new_handler first.
  std::new_handler nh = std::get_new_handler();
  if (nh != nullptr) {
    ABSL_RAW_LOG(ERROR,
                 "TCMalloc C++ Out of Memory: Trying to call new_handler.");
    nh();
    ABSL_RAW_CHECK(false,
                   "new_handler returned, but it should have thrown an "
                   "exception or terminated the program.");
  }

  // No new_handler, or new_handler returned, so just throw bad_alloc.
  ABSL_RAW_LOG(ERROR, "TCMalloc C++ Out of Memory: Throwing bad_alloc.");
  throw std::bad_alloc();
}
DefaultCppThrowHandler函数首先检查是否已经设置了C++的new_handler。如果设置了new_handler,函数会调用它。new_handler通常会尝试释放一些内存,以便分配可以成功。如果new_handler返回,说明它没有成功释放内存,函数会抛出一个std::bad_alloc异常。
在实际应用中,开发人员需要确保在使用tcmalloc进行内存分配时正确处理C++异常。这通常意味着在分配内存时使用try和catch语句,并在捕获到std::bad_alloc异常时采取适当的措施。
tcmalloc::allocate_full_malloc_oom
allocate_full_malloc_oom函数是tcmalloc库内部使用的一个函数,它用于处理内存分配失败的情况。当tcmalloc尝试分配内存,但无法找到足够的空闲内存时,它会调用这个函数。这个函数的主要目的是在遇到内存分配失败时提供一个处理策略。
在tcmalloc的源代码中,allocate_full_malloc_oom函数的实现如下:
void* TCMallocImplementation::allocate_full_malloc_oom(size_t size) {
  // If TCMalloc is not allowed to release memory to the system, we
  // can't really do anything here.
  if (!IsSystemReleaseAllowed()) {
    return nullptr;
  }
  // Try to free up some memory from the central cache.
  if (ReleaseAtLeastNBytesFromFreeList(size)) {
    return nullptr;
  }
  // Give up and return nullptr.
  return nullptr;
}
这个函数的工作方式如下:
- 首先检查tcmalloc是否允许将内存释放回操作系统。如果不允许,函数返回nullptr,表示分配失败。
- 如果允许释放内存,函数尝试从中央缓存释放至少size字节的内存。如果释放成功,函数返回nullptr,表示分配失败。
- 如果释放内存失败,函数返回nullptr,表示分配失败。
这个函数的主要作用是在遇到内存分配失败时尝试释放一些内存,以便其他分配请求可以成功。然而,如果释放内存的尝试失败,函数会返回nullptr,表示分配失败。在实际应用中,开发人员需要确保在使用tcmalloc分配内存时检查返回的指针是否为nullptr,并在遇到分配失败时采取适当的措施。
gperftools’ stacktrace capturing methods and their issues
We capture backtraces in tricky scenarios, such as in the CPU profiler case, where we capture backtraces from a signal handler. Therefore, we cannot rely on glibc’s backtrace() function. In practice today, no completely robust backtracing solution works for all use cases (but we’re getting closer, thankfully). So, we offer a range of stack trace capturing methods. This page describes our options and our current (Aug 2023) experience with them.
Use TCMALLOC_STACKTRACE_METHOD environment variable to select backtracing implementation at runtime. We also offer the TCMALLOC_STACKTRACE_METHOD_VERBOSE environment variable, which makes gperftools print a complete set of available options and which option is active.
The simplest way to see the list of available backtracing options on your system is by running “TCMALLOC_STACKTRACE_METHOD_VERBOSE=t ./stacktrace_unittest.”
$ TCMALLOC_STACKTRACE_METHOD_VERBOSE=t ./a.out
Chosen stacktrace method is generic_fp
Supported methods:
* libgcc
* generic_fp
* generic_fp_unsafe
* x86

backtrace() returned 4 addresses
...
Frame pointers
TLDR: Use TCMALLOC_STACKTRACE_METHOD=generic_fp when all code is compiled with frame pointers, and you’ll get nearly always correct and robust backtraces.
The simplest of all options is to rely on frame pointers. But this requires that all relevant code is compiled with frame pointers enabled. Most architectures default to no frame pointers configuration because maintaining frame pointers imposes a slight but significant performance penalty. So, to use frame pointers backtracing, you need to compile your code with options to enable them explicitly.
Libunwind
TLDR: This is our default. Also available via TCMALLOC_STACKTRACE_METHOD=libunwind environment variable. But it has occasionally upset people with crashes and deadlocks.
All modern architectures have ABI that defaults to not having frame pointers. Instead, we’re supposed to use various external “unwind info” metadata. It is usually using a facility originally introduced for exceptions. On ELF systems, this facility is typically utilizing the .eh_frame section. The data format is similar but not identical to DWARF unwind info (introduced to allow debuggers to show you backtraces) and is documented in gABI specs.
所有现代架构的ABI默认都不包含栈帧。相反,我们应该使用各种外部的”unwind info”元数据。它通常使用最初为异常引入的功能。在ELF系统上,这个功能通常利用.eh_frame部分。数据格式与DWARF解开信息类似但不完全相同(引入以允许调试器向您显示回溯),并在gABI规范中有详细记录。
libgcc’s _Unwind_Backtrace
TLDR: Use TCMALLOC_STACKTRACE_METHOD=libgcc and enable it by default via the “–enable-libgcc-unwinder-by-default” configure flag when running on the most recent Linux system.
Another library that can produce backtraces from unwind info is “libgcc_s.so”. But since its primary purpose is exceptions, it hasn’t always been fully robust especially for capturing backtraces from signal handlers.
However, most recent versions of this library (starting from gcc 12), running on very recent Linux distros (glibc version 2.35 and later), have been robust in our testing so far. This is thanks to glibc’s dl_find_object API that solves the problem of async-signal-safe access to a set of loaded ELF modules. We recommend enabling it by default, but only on systems that use dl_find_object API. With that said, please note that we’re not yet aware of this facility’s “crashiness” experience when it faces incorrect unwind info.
dlopen with RTLD_DEEPBIND causes crash
类似问题:jemalloc integration cause crashes when libraries or plugins dlopen with RTLD_DEEPBIND
Excepts from what Ulrich Drepper says about the RTLD_DEEPBIND flag he added:
("How To Write Shared Libraries", August 20, 2006,
http://people.redhat.com/drepper/dsohowto.pdf)

  this feature should only be used if it cannot be avoided. There are several
  reasonse for this:

    The change in the scope affects all symbols and all
    the DSOs which are loaded. Some symbols might
    have to be interposed by definitions in the global
    scope which now will not happen.

    Already loaded DSOs are not affected which could
    cause unconsistent results depending on whether
    the DSO is already loaded (it might be dynamically
    loaded, so there is even a race condition).

    ...

  The RTLD_DEEPBIND flag should really only be used as
  a last resort. Fixing the application to not depend on the
  flag's functionality is the much better solution.

The inconsistency that RTLD_DEEPBIND causes with jemalloc is that dynamic libraries opened with RTLD_DEEPBIND will use libc's malloc while libc is still using jemalloc.  A libc function may return a pointer to something that should be passed to free, and the dynamic library will call libc's free, but libc used jemalloc to allocate the memory.

I raised a question on this behavior here:
http://sourceware.org/ml/libc-alpha/2009-06/msg00168.html

But it looks like we can make libc's free (and malloc, etc) use jemalloc:
http://www.gnu.org/s/libc/manual/html_node/Hooks-for-Malloc.html
参考:Inconsistencies with RTLD_DEEPBIND and dependency libraries in global scope
% cat libdep.c
int duplicate = 'u';

int get_duplicate() {
  return duplicate;
}
% gcc -shared -fPIC libdep.c -o libdep.so
% cat dynamic.c
#include <stdio.h>

extern int duplicate;

int run() {
  duplicate = 'd';
  printf("dynamic sees duplicate from libdep as:  %c\n", duplicate);
  printf("but libdep sees duplicate from main as: %c\n", get_duplicate());
  return 0;
}
% gcc -shared -fPIC dynamic.c -Wl,-rpath,. -L. -ldep -o dynamic.so
% cat main.c
#include <dlfcn.h>
#include <stdlib.h>

extern int duplicate;

int main() {
  void *h;
  int (*run)();

  duplicate = 'm';

  h = dlopen("./dynamic.so", RTLD_LAZY | RTLD_DEEPBIND);
  if (!h)
    abort();

  run = dlsym(h, "run");
  if (!run)
    abort();

  (*run)();
}
% gcc main.c -Wl,-rpath,. -L. -ldep -ldl
% ./a.out
dynamic sees duplicate from libdep as:  d
but libdep sees duplicate from main as: m
Refer
- https://google.github.io/tcmalloc/
- TCMalloc Overview
- Announcing TCMalloc
- https://github.com/google/tcmalloc
- https://github.com/google/tcmalloc/tree/master/docs (官方文档)
- https://google.github.io/tcmalloc/
- TCMalloc : Thread-Caching Malloc
- 图解 TCMalloc
- TCMalloc 源码分析
- jemalloc
- ptmalloc、tcmalloc与jemalloc对比分析
- ptmalloc,tcmalloc和jemalloc内存分配策略研究
- TCMalloc解密
- C++的backtrace
- https://www.gnu.org/software/libc/manual/html_node/Backtraces.html