Linux in Action
- Linux 操作系统
- CPU
- 内存
- 网络
- 磁盘IO
- 信号处理
- Linux/UNIX Programming Interface
- 问题定位
- top (display Linux processes)
- dmesg
- strace (relies on ptrace system call)
- ltrace
- gdb
- gstack
- gcore
- disassemble
- backtrace
- assert
- lsof
- c++filt (Demangle C++ and Java symbols)
- addr2line (convert addresses into file names and line numbers)
- LD_DEBUG ./a.out
- df -T (查看文件系统类型)
- jq (Command-line JSON processor)
- ethtool
- yum (CentOS)
- scl
- eu-readelf
- xxd
- nfsiostat
- tcpdump
- netcat (nc)
- ldconfig
- rsync
- bpftrace
- true
- command -v
- 使用
LD_DEBUG环境变量查看某程序加载so的过程 - errno
- nproc
- 第三方工具
- List of Unix commands
- Q&A
Linux 操作系统
对 *nix 中 inode 的几点理解
在 *nix 系统中,inode 和 filename 是分离的,filename 只是 inode 的一个 readable 的绰号,directory 文件通过一系列 dirent 记录了 filename 和 inode 的对应关系,用户读取一个文件通过 filename->inode->data 的 3+n (n>=0) 层索引找到要读取的 block。
需要注意的几点:
- *nix 允许多个文件名指向同一个 inode 号码 (
stat file可查看连接数),即 hard-link;相反 soft-link 不会增加 Links 数目,只会增加新的 inode。 - 当 filename 包含特殊字符,无法正常 rm 时,可以通过先找到文件的 inode 号码再对其进行 delete。例如:
rm -rfi `find -inum 1805121`
- mv 重命名文件不影响 inode 号码,因此在对现网配置进行更新时不会导致程序 crash。

/proc (process information pseudo-filesystem)
The proc filesystem is a pseudo-filesystem which provides an interface to kernel data structures. It is commonly mounted at /proc. Typically, it is mounted automatically by the system, but it can also be mounted manually using a command such as:
mount -t proc proc /proc
Most of the files in the proc filesystem are read-only, but some files are writable, allowing kernel variables to be changed.
Underneath /proc, there are the following general groups of files and subdirectories:
refer:
- https://man7.org/linux/man-pages/man5/proc.5.html
- https://www.kernel.org/doc/html/latest/filesystems/proc.html
/proc/[pid]
Each one of these subdirectories contains files and subdirectories exposing information about the process with the corresponding process ID.
Underneath each of the /proc/[pid] directories, a task subdirectory contains subdirectories of the form task/[tid], which contain corresponding information about each of the threads in the process, where tid is the kernel thread ID of the thread.
/proc/[tid]
Each one of these subdirectories contains files and subdirectories exposing information about the thread with the corresponding thread ID. The contents of these directories are the same as the corresponding /proc/[pid]/task/[tid] directories.
/proc/self
When a process accesses this magic symbolic link, it resolves to the process’s own /proc/[pid] directory.
/proc/thread-self
When a thread accesses this magic symbolic link, it resolves to the process’s own /proc/self/task/[tid] directory.
/proc/[pid]/stat
Status information about the process. This is used by ps(1). It is defined in the kernel source file fs/proc/array.c.
~$cat /proc/3100717/stat
3100717 (unittestsvr) S 1 3100716 3100716 0 -1 4202560 1123163 0 56 0 1377525 296772 0 0 20 0 8 0 4715620677 3944722432 109878 18446744073709551615 4194304 47321236 140734650356688 140734650335168 140232066947133 0 0 3215367 18976 18446744073709551615 0 0 17 4 0 0 49 0 0 49420928 50225480 119697408 140734650366993 140734650367104 140734650367104 140734650392510 0
(1) pid %d
The process ID.
(2) comm %s
The filename of the executable, in parentheses. Strings longer than `TASK_COMM_LEN (16)` characters (including the terminating null byte) are silently truncated. This is visible whether or not the executable is swapped out.
(3) state %c
One of the following characters, indicating process state:

`R`  Running

`S`  Sleeping in an interruptible wait

`D`  Waiting in uninterruptible disk sleep

`Z`  Zombie

`T`  Stopped (on a signal) or (before Linux 2.6.33) trace stopped

`t`  Tracing stop (Linux 2.6.33 onward)

`W`  Paging (only before Linux 2.6.0)

`X`  Dead (from Linux 2.6.0 onward)

`x`  Dead (Linux 2.6.33 to 3.13 only)

`K`  Wakekill (Linux 2.6.33 to 3.13 only)

`W`  Waking (Linux 2.6.33 to 3.13 only)

`P`  Parked (Linux 3.9 to 3.13 only)
(4) ppid %d
The PID of the parent of this process.
(5) pgrp %d
The process group ID of the process.
(6) session %d
The session ID of the process.
(7) tty_nr %d
The controlling terminal of the process.
(8) tpgid %d
The ID of the foreground process group of the controlling terminal of the process.
(9) flags %u
The kernel flags word of the process. For bit meanings, see the PF_* defines in the Linux kernel source file include/linux/sched.h. Details depend on the kernel version.
(10) minflt %lu
The number of minor faults the process has made which have not required loading a memory page from disk.
(11) cminflt %lu
The number of minor faults that the process's waited-for children have made.
(12) majflt %lu
The number of major faults the process has made which have required loading a memory page from disk.
(13) cmajflt %lu
The number of major faults that the process's waited-for children have made.
(14) utime %lu
    Amount of time that this process has been scheduled
    in user mode, measured in clock ticks (divide by
    `sysconf(_SC_CLK_TCK)`).  This includes guest time,
    guest_time (time spent running a virtual CPU, see
    below), so that applications that are not aware of
    the guest time field do not lose that time from
    their calculations.
(15) stime %lu
    Amount of time that this process has been scheduled
    in kernel mode, measured in clock ticks (divide by
    `sysconf(_SC_CLK_TCK)`).
(16) cutime %ld
    Amount of time that this process's waited-for
    children have been scheduled in user mode, measured
    in clock ticks (divide by `sysconf(_SC_CLK_TCK)`).
    (See also times(2).)  This includes guest time,
    cguest_time (time spent running a virtual CPU, see
    below).
(17) cstime %ld
    Amount of time that this process's waited-for
    children have been scheduled in kernel mode,
    measured in clock ticks (divide by
    `sysconf(_SC_CLK_TCK)`).
(18) priority %ld
    (Explanation for Linux 2.6) For processes running a
    real-time scheduling policy (policy below; see
    sched_setscheduler(2)), this is the negated
    scheduling priority, minus one; that is, a number
    in the range -2 to -100, corresponding to real-time
    priorities 1 to 99.  For processes running under a
    non-real-time scheduling policy, this is the raw
    nice value (setpriority(2)) as represented in the
    kernel.  The kernel stores nice values as numbers
    in the range 0 (high) to 39 (low), corresponding to
    the user-visible nice range of -20 to 19.
(19) nice %ld
The nice value (see setpriority(2)), a value in the
range 19 (low priority) to -20 (high priority).
(20) num_threads %ld
Number of threads in this process (since Linux
2.6).  Before kernel 2.6, this field was hard coded
to 0 as a placeholder for an earlier removed field.
(21) itrealvalue %ld
The time in jiffies before the next SIGALRM is sent
to the process due to an interval timer.  Since
kernel 2.6.17, this field is no longer maintained,
and is hard coded as 0.
(22) starttime %llu
The time the process started after system boot.  In
kernels before Linux 2.6, this value was expressed
in jiffies.  Since Linux 2.6, the value is
expressed in clock ticks (divide by
sysconf(_SC_CLK_TCK)).
…
(52) exit_code %d (since Linux 3.5) [PT]
    The thread's exit status in the form reported by
    waitpid(2).
/proc/[pid]/statm
Provides information about memory usage, measured in pages. The columns are:
$getconf -a|grep -i page
PAGESIZE                           4096
PAGE_SIZE                          4096
_AVPHYS_PAGES                      157508
_PHYS_PAGES                        32857825
$cat /proc/1457274/statm
1079417 108417 5394 10532 0 887414 0
size (1) total program size
(same as VmSize in /proc/[pid]/status)
resident (2) resident set size
(inaccurate; same as VmRSS in /proc/[pid]/status)
shared (3) number of resident shared pages
(i.e., backed by a file)
(inaccurate; same as RssFile+RssShmem in
/proc/[pid]/status)
text (4) text (code)
lib (5) library (unused since Linux 2.6; always 0)
data (6) data + stack
dt (7) dirty pages (unused since Linux 2.6; always 0)
Some of these values are inaccurate because of a kernel-internal scalability optimization. If accurate values are required, use /proc/[pid]/smaps or /proc/[pid]/smaps_rollup instead, which are much slower but provide accurate, detailed information.
Signal
Linux supports both POSIX reliable signals (hereinafter “standard signals”) and POSIX real-time signals.
Using these system calls, a process can elect one of the following behaviors to occur on delivery of the signal: perform the default action; ignore the signal; or catch the signal with a signal handler, a programmer-defined function that is automatically invoked when the signal is delivered.
$kill -l
 1) SIGHUP       2) SIGINT       3) SIGQUIT      4) SIGILL       5) SIGTRAP
 2) SIGABRT      7) SIGBUS       8) SIGFPE       9) SIGKILL     10) SIGUSR1
1)  SIGSEGV     12) SIGUSR2     13) SIGPIPE     14) SIGALRM     15) SIGTERM
2)  SIGSTKFLT   17) SIGCHLD     18) SIGCONT     19) SIGSTOP     20) SIGTSTP
3)  SIGTTIN     22) SIGTTOU     23) SIGURG      24) SIGXCPU     25) SIGXFSZ
4)  SIGVTALRM   27) SIGPROF     28) SIGWINCH    29) SIGIO       30) SIGPWR
5)  SIGSYS      34) SIGRTMIN    35) SIGRTMIN+1  36) SIGRTMIN+2  37) SIGRTMIN+3
6)  SIGRTMIN+4  39) SIGRTMIN+5  40) SIGRTMIN+6  41) SIGRTMIN+7  42) SIGRTMIN+8
7)  SIGRTMIN+9  44) SIGRTMIN+10 45) SIGRTMIN+11 46) SIGRTMIN+12 47) SIGRTMIN+13
8)  SIGRTMIN+14 49) SIGRTMIN+15 50) SIGRTMAX-14 51) SIGRTMAX-13 52) SIGRTMAX-12
9)  SIGRTMAX-11 54) SIGRTMAX-10 55) SIGRTMAX-9  56) SIGRTMAX-8  57) SIGRTMAX-7
10) SIGRTMAX-6  59) SIGRTMAX-5  60) SIGRTMAX-4  61) SIGRTMAX-3  62) SIGRTMAX-2
11) SIGRTMAX-1  64) SIGRTMAX
- https://man7.org/linux/man-pages/man7/signal.7.html
- Why there are only two user defined signals?
Linux System Calls
How Linux programs call functions in the Linux kernel.
使用nasm写汇编,手动构造ELF格式文件。不使用c库,系统调用使用syscall指令(x86-64):
- 入参:
- eax = 系统调用号,可以在 /usr/include/asm/unistd_64.h 文件中找到
- rdi, rsi, rdx, r10, r8, r9 分别为第 1 至 6 个参数
- 出参:
- rax = 返回值(如果失败,返回 -errno)
- rcx, r11 被破坏(它们分别被 syscall 指令用来保存返回地址和 rflags)
- 其他寄存器的值保留
| Argument Type | Registers |
|---|---|
| Integer/Pointer Arguments 1-6 | RDI, RSI, RDX, RCX, R8, R9 |
| Floating Point Arguments 1-8 | XMM0 - XMM7 |
| Excess Arguments | Stack |
| Static chain pointer | R10 |
tar (compress/extract files)
- Compress an entire directory or a single file
tar -czvf name-of-archive.tar.gz /path/to/directory-or-file

-c: Create an archive.
-z: Compress the archive with gzip.
-v: Display progress in the terminal while creating the archive, also known as “verbose” mode. The v is always optional in these commands, but it’s helpful.
-f: Allows you to specify the filename of the archive.
- Compress multiple directories or files at once
tar -czvf archive.tar.gz /home/ubuntu/Downloads /usr/local/stuff /home/ubuntu/Documents/notes.txt
- Exclude directories and files
In some cases, you may wish to compress an entire directory, but not include certain files and directories. You can do so by appending an --exclude switch for each directory or file you want to exclude.
tar -czvf archive.tar.gz /home/ubuntu --exclude=/home/ubuntu/Downloads --exclude=/home/ubuntu/.cache
The --exclude switch is very powerful. It doesn’t take names of directories and files–it actually accepts patterns. There’s a lot more you can do with it. For example, you could archive an entire directory and exclude all .mp4 files with the following command:
tar -czvf archive.tar.gz /home/ubuntu --exclude=*.mp4
- Use bzip2 compression instead
While gzip compression is most frequently used to create .tar.gz or .tgz files, tar also supports bzip2 compression. This allows you to create bzip2-compressed files, often named .tar.bz2, .tar.bz, or .tbz files. To do so, just replace the -z for gzip in the commands here with a -j for bzip2.
Gzip is faster, but it generally compresses a bit less, so you get a somewhat larger file. Bzip2 is slower, but it compresses a bit more, so you get a somewhat smaller file
tar -cjvf archive.tar.bz2 stuff
- Extract an archive
Once you have an archive, you can extract it with the tar command. The following command will extract the contents of archive.tar.gz to the current directory. It’s the same as the archive creation command we used above, except the -x switch replaces the -c switch. This specifies you want to extract an archive instead of create one.
tar -xzvf archive.tar.gz
You may want to extract the contents of the archive to a specific directory. You can do so by appending the -C switch to the end of the command. For example, the following command will extract the contents of the archive.tar.gz file to the /tmp directory.
tar -xzvf archive.tar.gz -C /tmp
https://www.howtogeek.com/248780/how-to-compress-and-extract-files-using-the-tar-command-on-linux/
/proc
/proc/$pid/exe: 可执行文件软链接
kill / pkill / killall
| 特性 | kill | pkill | killall |
|---|---|---|---|
| 目标标识 | PID (进程ID) | 进程名模式匹配 | 精确进程名 |
| 默认信号 | SIGTERM(15) | SIGTERM(15) | SIGTERM(15) |
| 匹配方式 | 无匹配,直接指定 PID | 支持正则和模式匹配 | 精确匹配进程名 |
| 灵活性 | 最低 | 最高 | 中等 |
| 使用场景 | 知道具体 PID 时 | 基于名称模式批量操作 | 基于精确名称批量操作 |
使用建议
- 优先使用
SIGTERM(15),给进程清理资源的机会 - 谨慎使用
SIGKILL(9),可能导致数据丢失 - 先用
pkill -l或killall -i确认匹配的进程 - 在生产环境中,先测试匹配结果再执行
信号常用值
| 信号 | 数值 | 说明 |
|---|---|---|
| SIGHUP | 1 | 挂起 |
| SIGINT | 2 | 中断 |
| SIGQUIT | 3 | 退出 |
| SIGKILL | 9 | 强制终止 |
| SIGTERM | 15 | 优雅终止 (默认) |
| SIGSTOP | 19 | 暂停 |
$ kill -l
 1) SIGHUP       2) SIGINT       3) SIGQUIT      4) SIGILL       5) SIGTRAP
 2) SIGABRT      7) SIGBUS       8) SIGFPE       9) SIGKILL     10) SIGUSR1
1)  SIGSEGV     12) SIGUSR2     13) SIGPIPE     14) SIGALRM     15) SIGTERM
2)  SIGSTKFLT   17) SIGCHLD     18) SIGCONT     19) SIGSTOP     20) SIGTSTP
3)  SIGTTIN     22) SIGTTOU     23) SIGURG      24) SIGXCPU     25) SIGXFSZ
4)  SIGVTALRM   27) SIGPROF     28) SIGWINCH    29) SIGIO       30) SIGPWR
5)  SIGSYS      34) SIGRTMIN    35) SIGRTMIN+1  36) SIGRTMIN+2  37) SIGRTMIN+3
6)  SIGRTMIN+4  39) SIGRTMIN+5  40) SIGRTMIN+6  41) SIGRTMIN+7  42) SIGRTMIN+8
7)  SIGRTMIN+9  44) SIGRTMIN+10 45) SIGRTMIN+11 46) SIGRTMIN+12 47) SIGRTMIN+13
8)  SIGRTMIN+14 49) SIGRTMIN+15 50) SIGRTMAX-14 51) SIGRTMAX-13 52) SIGRTMAX-12
9)  SIGRTMAX-11 54) SIGRTMAX-10 55) SIGRTMAX-9  56) SIGRTMAX-8  57) SIGRTMAX-7
10) SIGRTMAX-6  59) SIGRTMAX-5  60) SIGRTMAX-4  61) SIGRTMAX-3  62) SIGRTMAX-2
11) SIGRTMAX-1  64) SIGRTMAX
场景示例
场景1: 终止浏览器进程
# kill - 知道具体 PID
ps aux | grep chrome
kill 8842 8843 8844

# pkill - 更灵活,可能匹配多个变体
pkill chrome
pkill -f "google-chrome"

# killall - 需要精确的进程名
killall chrome
killall google-chrome-stable
场景2: 安全地终止进程
# kill - 需要精确知道 PID,最安全
kill 1234

# pkill - 先预览匹配结果
pgrep firefox
pkill -l firefox
pkill firefox

# killall - 交互式确认
killall -i firefox
场景3: 批量操作
# 杀死所有 Python 相关进程
pkill -f "python"

# 杀死特定用户的所有进程
pkill -u username
killall -u username process_name

# 重载配置(不终止进程)
kill -HUP 1234
pkill -HUP nginx
killall -HUP nginx
场景4: 其他
> pgrep firefox
6316
6565
> pidof firefox
6565 6316

pkill firefox
killall <name>
kill -9 `pidof firefox`
kill -9 `pgrep firefox`
ps ax | grep <snippet> | grep -v grep | awk '{print $1}' | xargs kill
kill -STOP 命令用于发送一个 STOP 信号给指定的进程。STOP 信号(也称为 SIGSTOP)会导致进程暂停执行,即进程会被挂起(suspended)并停止运行。在收到 STOP 信号后,进程不会继续执行任何操作,直到收到一个 CONT(继续)信号(即 SIGCONT)。
kill -STOP <process_id>
发送 STOP 信号的一个常见用途是暂停一个正在运行的进程,以便在稍后恢复其执行。例如,可能希望暂停一个 CPU 密集型任务,以便在系统负载较低时继续运行。为了恢复暂停的进程,可以使用 kill -CONT 命令发送一个 CONT 信号:
kill -CONT <process_id>
kill 使用示例
# 基本语法
kill [信号] <PID>

# 常用示例
kill 1234                    # 优雅终止PID为1234的进程
kill -9 1234                 # 强制杀死进程
kill -TERM 1234 5678         # 终止多个进程
kill -l                      # 列出所有信号

# 实际应用场景
ps aux | grep nginx          # 先查找PID
kill 8842                    # 然后终止特定PID

# 杀死当前shell
kill $$                      # $$ 表示当前shell的PID
pkill 使用示例
# 1. 杀死所有 Firefox 进程
pkill firefox

# 2. 使用特定信号 (SIGKILL)
pkill -9 firefox
pkill -KILL firefox

# 3. 精确匹配进程名 (使用 -x 选项)
pkill -x bash

# 4. 杀死特定用户的进程
pkill -u username process_name

# 5. 使用正则表达式匹配
pkill -f "python.*script"  # 匹配命令行包含该模式的进程

# 6. 交互式模式 (确认每个进程)
pkill -i process_name

# 7. 只显示匹配的进程,不实际杀死
pkill -l process_name

# 8. 杀死进程组
pkill -g process_group_id
killall 使用示例
# 1. 杀死所有指定进程
killall firefox

# 2. 使用特定信号
killall -9 firefox
killall -KILL firefox
killall -SIGTERM firefox

# 3. 交互式模式
killall -i bash

# 4. 忽略大小写
killall -I FIREFOX

# 5. 等待进程结束
killall -w process_name

# 6. 列出所有支持的信号
killall -l

# 7. 杀死特定用户的进程
killall -u username process_name

# 8. 基于进程启动时间杀死进程
killall -o 1h process_name  # 杀死启动时间超过1小时的进程
killall -y 1h process_name  # 杀死启动时间少于1小时的进程
Process State (ps/top)
PROCESS STATE CODES:

Here are the different values that the s, stat and state output specifiers
(header "STAT" or "S") will display to describe the state of a process.

D Uninterruptible sleep (usually IO)

R Running or runnable (on run queue)

S Interruptible sleep (waiting for an event to complete)

T Stopped, either by a job control signal or because it is being traced.

W paging (not valid since the 2.6.xx kernel)

X dead (should never be seen)

Z Defunct ("zombie") process, terminated but not reaped by its parent.

For BSD formats and when the stat keyword is used, additional characters may be displayed:

< high-priority (not nice to other users)

N low-priority (nice to other users)

L has pages locked into memory (for real-time and custom IO)

s is a session leader

l is multi-threaded (using CLONE_THREAD, like NPTL pthreads do)

+ is in the foreground process group
ps
ps displays information about a selection of the active processes. If you want a repetitive update of the selection and the displayed information, use top instead.
This version of ps accepts several kinds of options:
- UNIX options, which may be grouped and must be preceded by a dash.
- BSD options, which may be grouped and must not be used with a dash.
- GNU long options, which are preceded by two dashes.
EXAMPLES
# To see every process on the system using standard syntax:
ps -ef

# To see every process on the system using BSD syntax:
ps aux

# To print a process tree:
ps -ejH
ps axjf

# To get info about threads:
ps -eLf
ps axms

# To get security info:
ps -eo euser,ruser,suser,fuser,f,comm,label

# To see every process running as root (real & effective ID) in user format:
ps -U root -u root u

# To see every process with a user-defined format:
ps -eo pid,tid,class,rtprio,ni,pri,psr,pcpu,stat,wchan:14,comm
ps axo stat,euid,ruid,tty,tpgid,sess,pgrp,ppid,pid,pcpu,comm
ps -Ao pid,tt,user,fname,tmout,f,wchan

# Print only the process IDs of syslogd:
ps -C syslogd -o pid=

# Print only the name of PID 42:
ps -q 42 -o comm=

# 查看进程精确的启动时间
ps -eo pid,lstart,cmd | grep your_process_name
$ps xao pid,ppid,pgid,sid,comm | head -n5
    PID    PPID    PGID     SID COMMAND
      1       0       1       1 systemd
     26       1      26      26 systemd-journal
     53       1      53      53 dbus-daemon
     54       1      54      54 systemd-logind
$ps -efj | less
UID          PID    PPID    PGID     SID  C STIME TTY          TIME CMD
root           1       0       1       1  0  2021 ?        00:44:06 /usr/sbin/init
root          26       1      26      26  0  2021 ?        00:13:28 /usr/lib/systemd/systemd-journald
# for example, ps -ejf | egrep 'STIME|http'
$ps -ejf | egrep 'STIME|ProcessName'
UID          PID    PPID    PGID     SID  C STIME TTY          TIME CMD
gerryya+ 2527581 2233037 2527580 2233012  0 12:11 pts/3    00:00:00 grep -E --color=auto STIME|ProcessName
- https://unix.stackexchange.com/questions/82724/ps-arguments-to-display-pid-ppid-pgid-and-sid-collectively
CPU
CPU个数
# 查看物理CPU个数
cat /proc/cpuinfo| grep "physical id"| sort| uniq| wc -l

# 查看每个物理CPU中core的个数(即核数)
cat /proc/cpuinfo| grep "cpu cores"| uniq

# 查看逻辑CPU的个数
cat /proc/cpuinfo| grep "processor"| wc -l
CPU负载
通过uptime命令可以查看机器的CPU负载,这三个数据分别是CPU 1分钟、5分钟、15分钟内系统的平均负载。当CPU完全空闲的时候,平均负载为0;当CPU工作量饱和的时候,平均负载为1。
$ uptime
 14:32:18 up 58 days, 23:20,  2 users,  load average: 5.55, 3.91, 3.78
理解CPU负载
首先,假设最简单的情况,你的电脑只有一个CPU,所有的运算都必须由这个CPU来完成。那么,我们不妨把这个CPU想象成一座大桥,桥上只有一根车道,所有车辆都必须从这根车道上通过。(很显然,这座桥只能单向通行。)
- 系统负载为0,意味着大桥上一辆车也没有。
- 系统负载为0.5,意味着大桥一半的路段有车。
- 系统负载为1.0,意味着大桥的所有路段都有车,也就是说大桥已经”满”了。但是必须注意的是,直到此时大桥还是能顺畅通行的。
- 系统负载为1.7,意味着车辆太多了,大桥已经被占满了(100%),后面等着上桥的车辆为桥面车辆的70%。以此类推,系统负载2.0,意味着等待上桥的车辆与桥面的车辆一样多;系统负载3.0,意味着等待上桥的车辆是桥面车辆的2倍。总之,当系统负载大于1,后面的车辆就必须等待了;系统负载越大,过桥就必须等得越久。
CPU的系统负载,基本上等同于上面的类比。大桥的通行能力,就是CPU的最大工作量;桥梁上的车辆,就是一个个等待CPU处理的进程(process)。为了顺畅运行,系统负载最好不要超过1.0,这样就没有进程需要等待了,所有进程都能第一时间得到处理。很显然,1.0是一个关键值,超过这个值,系统就不在最佳状态了。
经验法则
1.0是系统负载的理想值吗?不一定,系统管理员往往会留一点余地,当这个值达到0.7,就应当引起注意了。经验法则是这样的:
- 当系统负载持续大于0.7,你必须开始调查了,问题出在哪里,防止情况恶化。
- 当系统负载持续大于1.0,你必须动手寻找解决办法,把这个值降下来。
- 当系统负载达到5.0,就表明你的系统有很严重的问题,长时间没有响应,或者接近死机了。你不应该让系统达到这个值。
多处理器
如果你的电脑装了2个CPU,会发生什么情况呢?
- 2个CPU,意味着电脑的处理能力翻了一倍,能够同时处理的进程数量也翻了一倍。还是用大桥来类比,两个CPU就意味着大桥有两根车道了,通车能力翻倍了。
- 所以,
2个CPU表明系统负载可以达到2.0,此时每个CPU都达到100%的工作量。推广开来,n个CPU的电脑,可接受的系统负载最大为n.0。
多核处理器
芯片厂商往往在一个CPU内部,包含多个CPU核心,这被称为多核CPU。在系统负载方面,多核CPU与多CPU效果类似,所以考虑系统负载的时候,必须考虑这台电脑有几个CPU、每个CPU有几个核心。然后,把系统负载除以总的核心数,只要每个核心的负载不超过1.0,就表明系统正常运行。
怎么知道有多少个CPU核心呢?
$ grep -c 'model name' /proc/cpuinfo
48
观察时长
“load average”一共返回三个平均值:1分钟系统负载、5分钟系统负载,15分钟系统负载。应该参考哪个值?
- 如果只有1分钟的系统负载大于1.0,其他两个时间段都小于1.0,这表明只是暂时现象,问题不大。
- 如果15分钟内,平均系统负载大于1.0(调整CPU核心数之后),表明问题持续存在,不是暂时现象。所以,你应该主要观察”15分钟系统负载”,将它作为系统正常运行的指标。
CPU负载采集算法
通过读取/proc/loadavg文件来得到CPU的1分钟、5分钟、15分钟平均负载。一般来说CPU负载带了两位的小数。为了保留精度,会把CPU负载值乘以100再上报。
$ cat /proc/loadavg
5.26 4.80 4.65 4/8728 1837325
CPU使用率采集算法
CPU使用率衡量的是程序运行占用的CPU百分比。Linux的CPU使用率信息可以通过/proc/stat文件计算得到。/proc/stat包含了所有CPU活动的信息,该文件中的所有值都是从系统启动开始累计的,单位为jiffies。
$ cat /proc/stat | grep 'cpu'

cpu  4409701839 5860491 3043372756 11777957443 471600199 13606335 49392558 0
cpu0 980245201 1554799 596504303 3214215192 126029552 6603537 17697344 0
cpu1 1209283591 1411942 861982464 2749190858 113506249 255348 7220138 0
cpu2 971403569 1530154 624934033 3195318936 125767475 6491354 17450205 0
cpu3 1248769476 1363594 959951956 2619232456 106296922 256096 7024869 0
cpu一行指的是总的CPU信息,cpu0、cpu1、cpu2、cpu3几行指的是CPU各个核的CPU信息。从这里也可以看出这台服务器共有4个核。每列从左到右的意思为:
user:从系统启动开始累计到当前时刻,用户态的CPU时间 ,不包含nice值为负进程。nice:从系统启动开始累计到当前时刻,nice值为负的进程所占用的CPU时间system:从系统启动开始累计到当前时刻,内核态时间idle:从系统启动开始累计到当前时刻,除硬盘IO等待时间以外其它等待时间iowait:从系统启动开始累计到当前时刻,硬盘IO等待时间irq:从系统启动开始累计到当前时刻,硬中断时间softirq:从系统启动开始累计到当前时刻,软中断时间steal:在虚拟环境下 CPU 花在处理其他作业系统的时间,Linux 2.6.11 开始才开始支持。guest:在 Linux 内核控制下 CPU 为 guest 作业系统运行虚拟 CPU 的时间,Linux 2.6.24 开始才开始支持。(因为内核版本不支持,上面的示例没有这一列)
根据这些信息,就可以计算出CPU使用率。CPU使用率采集算法如下(以CPU0为例):
# 得到cpu0的信息
cat /proc/stat | grep 'cpu0'

cpu_total1 = user + nice + system + idle + iowait + irq + softirq
cpu_used1 = user + nice + system + irq + softirq

# 等待15s
sleep 15

# 再次检查cpu信息
cat /proc/stat | grep 'cpu0'

cpu_total2 = user + nice + system + idle + iowait + irq + softirq
cpu_used2 = user + nice + system + irq + softirq

# 得到cpu0在15秒内的平均使用率
(cpu_used2 - cpu_used1) / (cpu_total2 - cpu_total1) * 100%
采集策略:每分钟会采集4次15秒内的CPU平均使用率。为了避免漏采集CPU峰值,取这一分钟内四次采集的最大值上报。
CPU进程使用率采集算法
$cat /proc/3100717/stat
3100717 (unittestsvr) S 1 3100716 3100716 0 -1 4202560 1123163 0 56 0 1377525 296772 0 0 20 0 8 0 4715620677 3944722432 109878 18446744073709551615 4194304 47321236 140734650356688 140734650335168 140232066947133 0 0 3215367 18976 18446744073709551615 0 0 17 4 0 0 49 0 0 49420928 50225480 119697408 140734650366993 140734650367104 140734650367104 140734650392510 0
参考 https://man7.org/linux/man-pages/man5/proc.5.html,其中 14 -17 四个参数中分别表示进程的 utime,stime,cutime,cstime。
公式:ProcessTime = utime + stime + cutime + cstime
每个进程的 CPU 利用率的计算方法如下:
(1) T1 时刻读取 /proc/stat,计算 sum1,读取 /proc/pid/stat,利用公式计算 pt1
(2) T2 时刻读取 /proc/stat,计算 sum2,读取 /proc/pid/stat,利用公式计算 pt2
(3) 进程 CPU 利用率 = (pt2 - pt1) * 100 /(sum2 - sum1)
内存
通过free命令,可以看到服务器内存的使用情况。
-h表示 show human-readable output-m表示 Display the amount of memory in megabytes- Mem 含义
total: 总内存used: 已经使用的内存free: 空闲内存
- Swap 含义:交换分区
# free
             total       used       free     shared    buffers     cached
Mem:       1017796     819720     198076      16784      46240     468880
-/+ buffers/cache:     304600     713196
Swap:            0          0          0
在很多Linux服务器上运行free命令,会发现剩余内存(Mem:行的free列)很少,但实际服务器上的进程并没有占用很大的内存。这是因为Linux特殊的内存管理机制。Linux内核会把空闲的内存用作buffer/cached,用于提高文件读取性能。当应用程序需要用到内存时,buffer/cached内存是可以马上回收的。所以,对应用程序来说,buffer/cached是可用的,可用内存应该是free+buffers+cached。因为这个原因,free命令也才有第三行的-/+ buffers/cache。
通过top命令查看内存。
KiB Mem :  1009184 total,    98908 free,   399864 used,   510412 buff/cache
KiB Swap:        0 total,        0 free,        0 used.   453712 avail Mem

PID USER    PR  NI    VIRT    RES    SHR S %CPU %MEM     TIME+  COMMAND
1 root      20   0   77908   6184   3808 S  0.0  0.6   2:25.47 systemd
- VIRT,进程虚拟内存的大小,虚拟内存并不会全部分配物理内存
- RES,常驻内存的大小,是进程实际使用的物理内存大小,但不包括Swap和共享内存
- SHR,共享内存大小,比如,与其他进程共同使用的共享内存,加载的动态链接库以及程序的代码段等
- %MEM,进程使用物理内存占系统总内存的百分比
可以使用pmap -xp $pid分析下进程的内存分布,更详细的信息可以通过cat /proc/$pid/smaps (since Linux 2.6.14)来查看每个进程的内存消耗情况。
refer:
整个内存采集算法
问题:Actual memory usage of a process
采集free命令的这几个结果(实际是通过读取/proc/meminfo来得到的),然后每4分钟上报一次:
- MEM 使用量:Mem:的
total - free - MEM 总大小:Mem:的
total - 应用程序使用内存:-/+ buffers/cache:的
used
某进程内存采集算法
从进程的角度来判断服务器的内存占用。Linux 内核 2.6.14 及以上版本增加了/proc/(进程ID)/smaps文件,通过 smaps 文件可以分析进程具体占用的每一段内存。
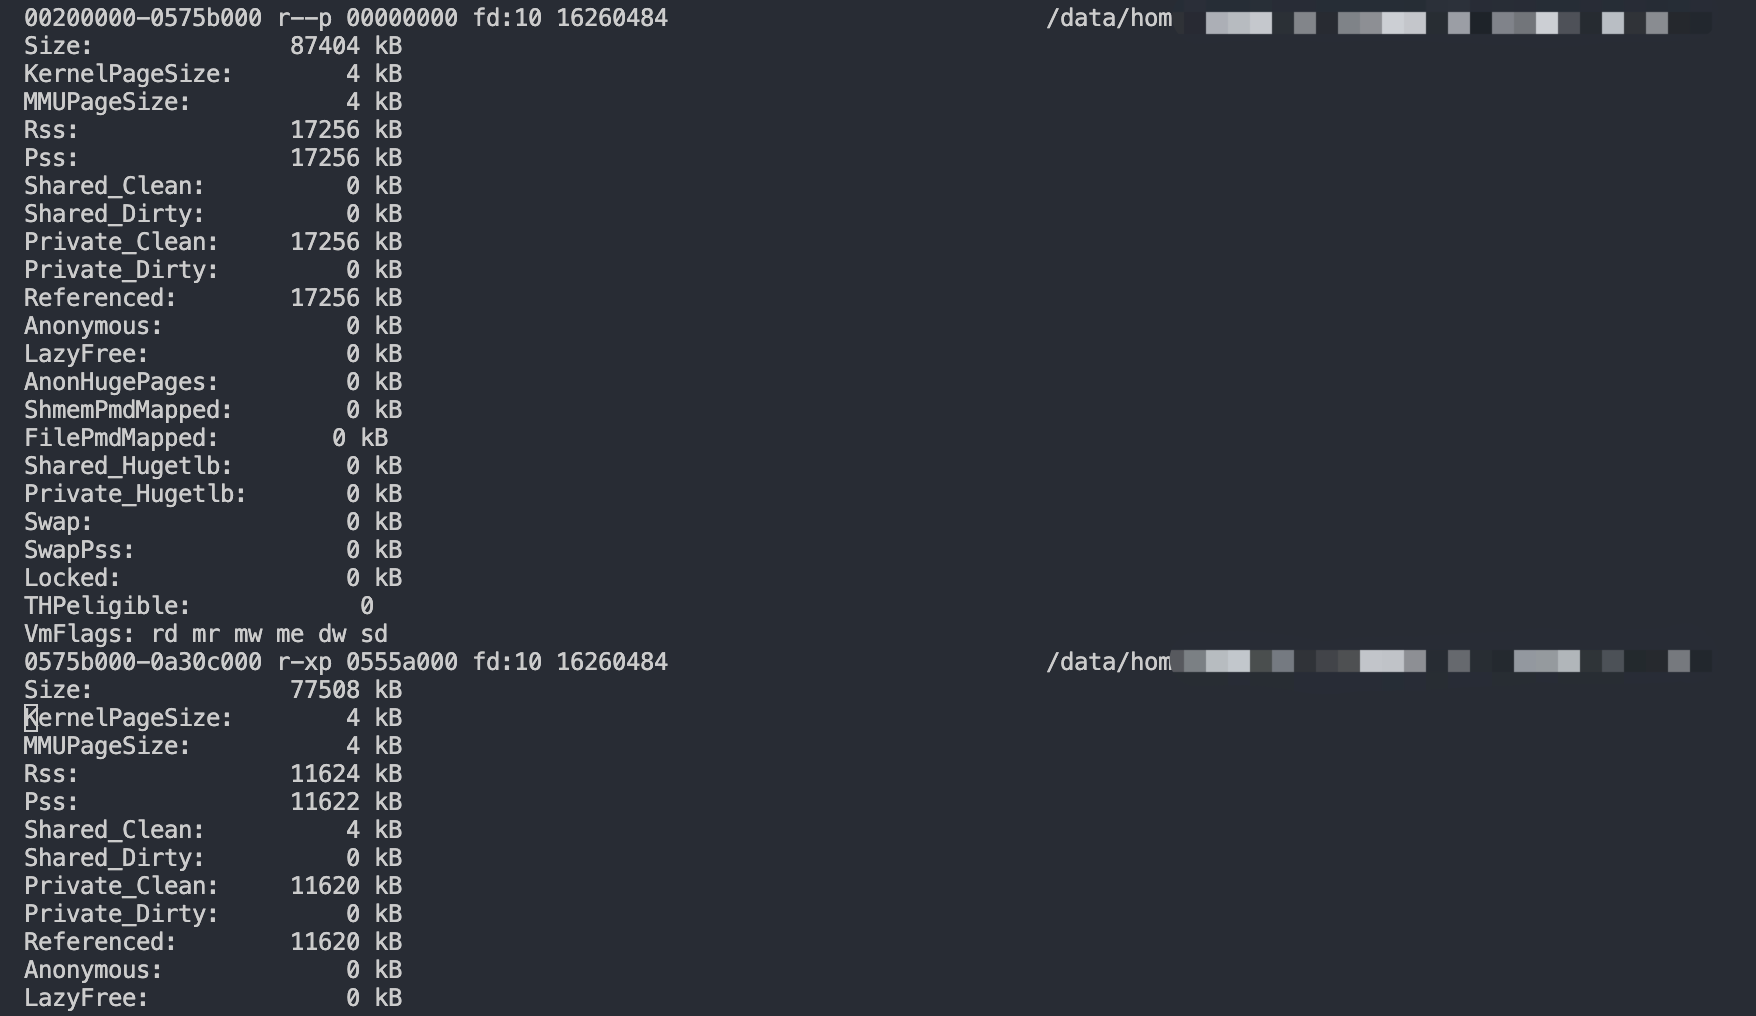
通过 smaps 文件,可以计算出两个指标:
- 进程 Virtual 内存:通过把 smaps 文件所有的
Size的大小加起来得到 - 进程 Private 内存:通过把 smaps 文件所有的
Private_Clean、Private_Dirty大小加起来得到
通过此方法,也可以计算所有进程的内存使用:
通过 smaps 文件计算所有进程的 Virtual 内存总和、Private 内存总和,并计算共享内存总和,得到下面3个指标并上报。每4分钟上报一次。
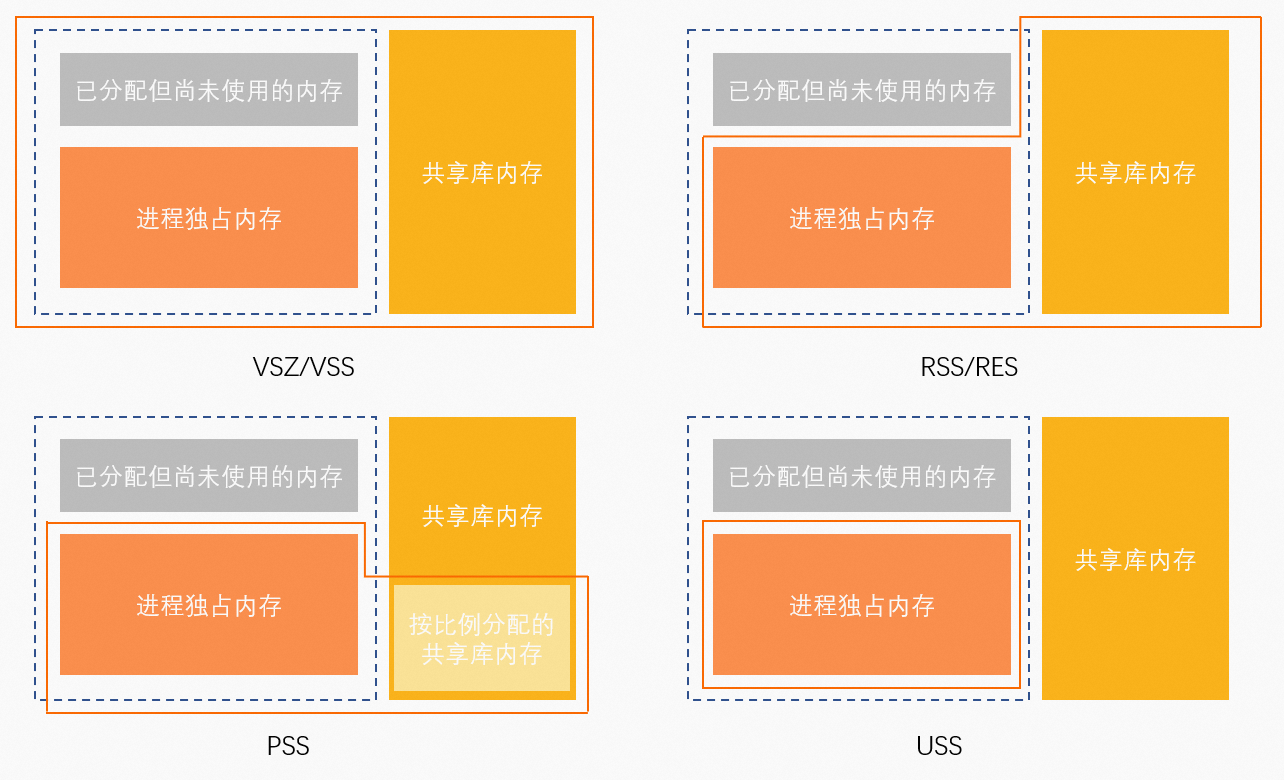
- Virtual 内存占用:通过计算所有进程的 Virtual 内存总和得到。可以用来判断进程是否存在内存泄漏。如果一台机器 Virtual 内存占用持续上涨,便很有可能发生了内存泄漏。
- Private 内存占用:通过计算所有进程的 Private 内存总和得到。Private 内存都是映射在物理内存中的,因此通过总 Private 内存,我们可以知道机器至少需要多少物理内存。
- Private 内存 + 共享内存占用:通过 Private 内存占用,再加上机器上的共享内存,得到的指标。可以用来粗略衡量机器实际的内存占用。
参考:Getting information about a process’ memory usage from /proc/pid/smaps
Clean pages are pages that have not been modified since they were mapped (typically, text sections from shared libraries are only read from disk (when necessary), never modified, so they’ll be in shared, clean pages). Dirty pages are pages that are not clean (i.e. have been modified).
Private pages are available only to that process, shared pages are mapped by other processes*.
RSS is the total number of pages, shared or not, currently mapped into the process. So Shared_Clean + Shared_Dirty would be the shared part of the RSS (i.e. the part of RSS that is also mapped into other processes), and Private_Clean + Private_Dirty the private part of RSS (i.e. only mapped in this process).
PSS (proportional share size) is as you describe. Private pages are summed up as is, and each shared mapping’s size is divided by the number of processes that share it. So if a process had 100k private pages, 500k pages shared with one other process, and 500k shared with four other processes, the PSS would be:
100k + (500k / 2) + (500k / 5) = 450k
Further readings:
- ELC: How much memory are applications really using?
- Documentation/filesystems/proc.txt in the kernel source
- man proc(5)
- Linux Memory Management Overview
- Memory Management at TLDP.org
- LinuxMM
Regarding process-wide sums:
- RSS can be (approximately) obtained by summing the
Rss: entries in smaps
# 单位 kB
awk '/Rss:/{ sum += $2 } END { print sum }' /proc/$pid/smaps
-
You can sum up
Pss: values the same way, to get process-global PSS. -
USS isn’t reported in smaps, but indeed, it is the sum of private mappings, so you can obtain it the same way too
常用命令
pmap
$pmap -x `pidof gamesvr`
...
Address           Kbytes     RSS   Dirty Mode  Mapping
0000000000400000   51732   30036       0 r-x-- gamesvr
0000000003885000     520     424      20 r-x-- gamesvr
0000000003907000     452     252      84 rwx-- gamesvr
0000000003978000   25832    8044    8044 rwx--   [ anon ]
0000000005ac2000   12288    4264    4264 rwx--   [ anon ]
00000000066c2000  505840  344500  344500 rwx--   [ anon ]
...
---------------- ------- ------- -------
total kB         1372708  402092  367472
smem
smem 需要单独安装。
- USS (Unique Set Size),独占内存 =
anno_rss - PSS (Proportional Set Size),按比例分配内存 =
anno_rss + file_rss/m + shmem_rss/n - RSS (Resident Set Size),映射的物理内存 =
anno_rss + file_rss + shmem_rss
  PID User     Command                         Swap      USS      PSS      RSS
    1 root     /pause                             0       36       57      412
  939 root     crond -s -P                        0      892     1271     3128
17880 root     bash                               0     3160     3581     5420
 2234 root     /usr/libexec/platform-pytho        0    10760    11307    13324
  284 root     /deploysidecar/bin/xxxxxxx1        0    15792    30939    47592
 1295 root     /data/home/user00/xxxxxxxx2        0    40396    40540    41740
 3138 root     /data/home/user00/xxxxxxxx3        0  5242696  5254234  5267336
dump memory (gdb)
根据pmap输出的进程地址可以通过gdb将内存的内容dump出来。
(gdb) dump memory memory.dump 0x66c2000 0x66d2000
(gdb) !strings memory.dump | head -n10
%%%%%%%%%%%%%%%%
或者:
gdb –batch –pid {PID} -ex “dump memory native_memory.dump 0x66c2000 0x66d2000”
refer
- Linux中进程内存及cgroup内存统计差异
- https://techtalk.intersec.com/2013/07/memory-part-1-memory-types/
- https://techtalk.intersec.com/2013/07/memory-part-2-understanding-process-memory/
- https://techtalk.intersec.com/2013/08/memory-part-3-managing-memory/
- https://techtalk.intersec.com/2013/10/memory-part-4-intersecs-custom-allocators/
- https://techtalk.intersec.com/2013/12/memory-part-5-debugging-tools/
网络
流量和包量统计
通过/proc/net/dev文件,可以计算出服务器的流量(bytes)及包量(packets)。其中,/proc/net/dev的数值是从系统启动后一直累加的。
注意:在32位系统上,/proc/net/dev中的数值系统使用4个字节的无符号整型保存,当数值达到2^32-1,即4294967295之后,数值会溢出,计算流量包量时需要把这一点考虑进去。而64位系统中/proc/net/dev使用的是8个字节的无符号整型,因此就不需要注意溢出的问题。
$ cat /proc/net/dev
Inter-|   Receive                                                |  Transmit
 face |bytes    packets errs drop fifo frame compressed multicast|bytes    packets errs drop fifo colls carrier compressed
   br0:       0       0    0    0    0     0          0         0        0       0    0    0    0     0       0          0
  eth1: 20762575244 116974442    0    0    0     0          0         0 27863156472 128930710    0    0    0     0       0          0
    lo: 1857145146 24970433    0    0    0     0          0         0 1857145146 24970433    0    0    0     0       0          0
docker0:       0       0    0    0    0     0          0         0        0       0    0    0    0     0       0          0
如何计算网卡流量,以eth1为例:
- 读取
/proc/net/dev文件,获取eth1的Recevie bytes、Receive packets、Transmit bytes、Transmit packets,分别记为receive_bytes0、receive_packets0、transmit_bytes0、transmit_packets0 - sleep 60秒
- 再次读取
/proc/net/dev文件,获取eth1的Receive bytes、Receive packets、Transmit bytes、Transmit packets,分别记为receive_bytes1、receive_packets1、transmit_bytes1、transmit_packets1 - 根据60秒前后的
/proc/net/dev文件,便可计算出下面的指标:
- 60秒内平均每秒入流量:
(receive_bytes1 - receive_bytes0) * 8 / 60 / 1000 (kbps)(乘以8是为了把bytes转成bit,除以1000是为了把单位转成k,除以60则是取60秒内的平均值) - 60秒内平均每秒出流量:
(transmit_bytes1 - transmit_bytes0) * 8 / 60 / 1000 (kbps) - 60秒内平均每秒入包数:
(receive_packets1 - receive_packets0) / 60 (个) - 60秒内平均每秒出包数:
(transmit_packets1 - transmit_packets0) / 60 (个)
TCP链接数
/proc/net/snmp记录了一些TCP信息,其中比较有用的是CurrEstab字段,即当前已建立的TCP连接数。
$ cat /proc/net/snmp
Ip: Forwarding DefaultTTL InReceives InHdrErrors InAddrErrors ForwDatagrams InUnknownProtos InDiscards InDelivers OutRequests OutDiscards OutNoRoutes ReasmTimeout ReasmReqds ReasmOKs ReasmFails FragOKs FragFails FragCreates
Ip: 1 64 134291507 0 2 0 0 0 134291505 146203684 362 218 0 0 0 0 6 0 18
Icmp: InMsgs InErrors InCsumErrors InDestUnreachs InTimeExcds InParmProbs InSrcQuenchs InRedirects InEchos InEchoReps InTimestamps InTimestampReps InAddrMasks InAddrMaskReps OutMsgs OutErrors OutDestUnreachs OutTimeExcds OutParmProbs OutSrcQuenchs OutRedirects OutEchos OutEchoReps OutTimestamps OutTimestampReps OutAddrMasks OutAddrMaskReps
Icmp: 106100 2 0 737 0 0 0 0 105328 35 0 0 0 0 106102 0 738 0 0 0 0 36 105328 0 0 0 0
IcmpMsg: InType0 InType3 InType8 OutType0 OutType3 OutType8
IcmpMsg: 35 737 105328 105328 738 36
Tcp: RtoAlgorithm RtoMin RtoMax MaxConn ActiveOpens PassiveOpens AttemptFails EstabResets CurrEstab InSegs OutSegs RetransSegs InErrs OutRsts InCsumErrors
Tcp: 1 200 120000 -1 105094 27940 218 10479 39 134181152 143798757 1057 0 7716 0
Udp: InDatagrams NoPorts InErrors OutDatagrams RcvbufErrors SndbufErrors InCsumErrors IgnoredMulti
Udp: 1435 738 0 10020862 0 0 0 1
UdpLite: InDatagrams NoPorts InErrors OutDatagrams RcvbufErrors SndbufErrors InCsumErrors IgnoredMulti
UdpLite: 0 0 0 0 0 0 0 0
UDP接收和发送数据报
/proc/net/snmp还记录了一些UDP信息,其中比较有用的是InDatagrams及OutDatagrams字段。
UDP接收和发送数据报计算方法与/proc/net/dev类似,步骤如下:
- 读取
/proc/net/snmp得到InDatagrams及OutDatagrams,分别记为in_data0和out_data0 - sleep 60秒
- 再次读取
/proc/net/snmp得到InDatagrams及OutDatagrams,分别记为in_data1和out_data1 - 根据60秒前后的
/proc/net/snmp文件,便可计算下面两个指标:
- 60秒内平均每秒UDP入数据报:
(in_data1 - in_data0) / 60 - 60秒内平均每秒UDP出数据报:
(out_data1 - out_data0) / 60
根据socket查找ip信息
Tracing socket (file) descriptor back to bound address
lsof | grep pid.*sd.*IP
pidis to be replaced by the program process idsdis to be replaced by the socket descriptor as shown by strace
例子:
$strace -p14407 -e recvfrom
Process 14407 attached
recvfrom(55, 0x65c86000, 667104, 0, 0, 0) = -1 EAGAIN (Resource temporarily unavailable)
recvfrom(56, 0x65f1e000, 667104, 0, 0, 0) = -1 EAGAIN (Resource temporarily unavailable)
...

$lsof | grep 14407.*55.*IP
gamesvr   14407       gerryyang   55u     IPv4         1098817885        0t0        TCP qsm_cloud_dev-15:51496->9.143.64.189:8856 (ESTABLISHED)
gamesvr   14407 14409 gerryyang   55u     IPv4         1098817885        0t0        TCP qsm_cloud_dev-15:51496->9.143.64.189:8856 (ESTABLISHED)
gamesvr   14407 14410 gerryyang   55u     IPv4         1098817885        0t0        TCP qsm_cloud_dev-15:51496->9.143.64.189:8856 (ESTABLISHED)
...
根据fd找到ip信息
ls -lrt /proc/24748/fd | grep 854
netstat -e | grep 169393703

# or
lsof -i -a -p 20640
TIME_WAIT
echo 1 > /proc/sys/net/ipv4/tcp_tw_reuse
echo 1 > /proc/sys/net/ipv4/tcp_tw_recycle
- tcp_tw_reuse、tcp_tw_recycle 使用场景及注意事项
- Linux tcp_tw_reuse = 2 — how is this set and what is the significance?
- net-tcp: extend tcp_tw_reuse sysctl to enable loopback only optimization
本地端口范围设置
注意,如果服务器有较多程序开放端口,请注意程序的端口开放范围,以避免随机端口跟设置的端口范围冲突。
$cat /proc/sys/net/ipv4/ip_local_port_range
32768   61000
常用命令
ss (another utility to investigate sockets)
ss is used to dump socket statistics. It allows showing information similar to netstat. It can display more TCP and state information than other tools.
$ ss -s
Total: 2144
TCP:   2000 (estab 1757, closed 200, orphaned 0, timewait 200)

Transport Total     IP        IPv6
RAW       2         1         1
UDP       13        11        2
TCP       1800      1795      5
INET      1815      1807      8
FRAG      0         0         0
$ ss -ltupn
State       Recv-Q Send-Q    Local Address:Port     Peer Address:Port
LISTEN      0      128       *:15434                *:*                     users:(("tconnd",pid=3304405,fd=35))
nslookup
query Internet name servers interactively
# nslookup 8.8.8.8
Server:         8.8.8.8
Address:        8.8.8.8#53

Non-authoritative answer:
8.8.8.8.in-addr.arpa    name = google-public-dns-a.google.com.

Authoritative answers can be found from:
$ nslookup gerryyang.com
Server:         10.85.61.21
Address:        10.85.61.21#53

Non-authoritative answer:
Name:   gerryyang.com
Address: 119.28.41.102
dig
$ dig gerryyang.com

; <<>> DiG 9.11.26-RedHat-9.11.26-4.tl3 <<>> gerryyang.com
;; global options: +cmd
;; Got answer:
;; ->>HEADER<<- opcode: QUERY, status: NOERROR, id: 27567
;; flags: qr rd ra; QUERY: 1, ANSWER: 1, AUTHORITY: 0, ADDITIONAL: 1

;; OPT PSEUDOSECTION:
; EDNS: version: 0, flags:; udp: 4000
;; QUESTION SECTION:
;gerryyang.com.                 IN      A

;; ANSWER SECTION:
gerryyang.com.          598     IN      A       119.28.41.102

;; Query time: 271 msec
;; SERVER: 10.85.61.21#53(10.85.61.21)
;; WHEN: Wed Jan 31 20:05:05 CST 2024
;; MSG SIZE  rcvd: 58
nc
ncat [options] [hostname] [port]

# test UDP port was open or not
nc -vzu <host> <port>

on server listen UDP port: `nc -ul 6111`
on client: `nc -u <server> 6111`
https://serverfault.com/questions/416205/testing-udp-port-connectivity
https://en.wikipedia.org/wiki/Netcat#Test_if_UDP_port_is_open:_simple_UDP_server_and_client
磁盘IO
iostat
$ iostat -x 10

avg-cpu:  %user   %nice %system %iowait  %steal   %idle
           3.74    0.01    3.88    0.01    0.00   92.36

Device:         rrqm/s   wrqm/s     r/s     w/s    rkB/s    wkB/s avgrq-sz avgqu-sz   await r_await w_await  svctm  %util
vda               0.00     5.90    0.00    2.10     0.00    66.40    63.24     0.00    0.57    0.00    0.57   0.57   0.12
vdb               0.00     0.60    0.00   14.90     0.00   204.40    27.44     0.05    3.30    0.00    3.30   0.16   0.24
scd0              0.00     0.00    0.00    0.00     0.00     0.00     0.00     0.00    0.00    0.00    0.00   0.00   0.00
vdd               0.00     1.10    0.00    0.40     0.00     6.00    30.00     0.00    0.00    0.00    0.00   0.00   0.00
vdc               0.00     7.70    0.00    6.90     0.00    96.40    27.94     0.00    0.52    0.00    0.52   0.52   0.36
vdf               0.00     1.20    0.00    2.10     0.00    14.00    13.33     0.00    0.00    0.00    0.00   0.00   0.00
vdg               0.00     0.70    0.00    0.40     0.00     4.40    22.00     0.00    2.00    0.00    2.00   2.00   0.08
vdl               0.00     3.80    0.00    1.40     0.00    25.60    36.57     0.00    0.57    0.00    0.57   0.57   0.08
vdi               0.00     0.50    0.00    0.20     0.00     2.80    28.00     0.00    0.00    0.00    0.00   0.00   0.00
vdm               0.00     1.50    0.00    0.60     0.00     9.60    32.00     0.00    0.67    0.00    0.67   0.67   0.04
vdn               0.00     0.50    0.00    0.20     0.00     2.80    28.00     0.00    0.00    0.00    0.00   0.00   0.00
vdo               0.00     0.50    0.00    0.20     0.00     2.80    28.00     0.00    0.00    0.00    0.00   0.00   0.00
vdr               0.00     0.50    0.00    0.20     0.00     2.80    28.00     0.00    0.00    0.00    0.00   0.00   0.00
vdj               0.00     0.50    0.00    0.20     0.00     2.80    28.00     0.00    0.00    0.00    0.00   0.00   0.00
vdt               0.00     0.50    0.00    0.20     0.00     2.80    28.00     0.00    0.00    0.00    0.00   0.00   0.00
vde               0.00     0.70    0.00    0.40     0.00     4.40    22.00     0.00    2.00    0.00    2.00   2.00   0.08
vdq               0.00     0.50    0.00    0.20     0.00     2.80    28.00     0.00    0.00    0.00    0.00   0.00   0.00
vdp               0.00     0.50    0.00    0.20     0.00     2.80    28.00     0.00    0.00    0.00    0.00   0.00   0.00
vds               0.00     0.50    0.00    0.20     0.00     2.80    28.00     0.00    0.00    0.00    0.00   0.00   0.00
vdh               0.00     5.30    0.00    1.50     0.00   258.80   345.07     0.00    2.40    0.00    2.40   1.07   0.16
vdk               0.00     0.50    0.00    0.20     0.00     2.80    28.00     0.00    0.00    0.00    0.00   0.00   0.00
每一列的含义如下:
rrqm/s: 每秒进行merge的读操作数目。wrqm/s: 每秒进行merge的写操作数目。r/s: 每秒完成的读 I/O 设备次数。w/s: 每秒完成的写 I/O 设备次数。rsec/s: 每秒读扇区数。wsec/s: 每秒写扇区数。rkB/s: 每秒读K字节数。是rsec/s的一半,因为扇区大小为512字节wkB/s: 每秒写K字节数。是wsec/s的一半avgrq-sz: 平均每次设备I/O操作的数据大小 (扇区)avgqu-sz: 平均I/O队列长度。await: 平均每次设备I/O操作的等待时间 (毫秒)svctm: 平均每次设备I/O操作的服务时间 (毫秒)%util: 一秒中有百分之多少的时间用于 I/O 操作,或者说一秒中有多少时间 I/O 队列是非空的。
怎么理解这里的字段呢?下面以超市结账的例子来说明。
r/s+w/s类似于交款人的总数avgqu-sz(平均队列长度):类似于单位时间里平均排队的人数svctm(平均服务时间)类似于收银员的收款速度await(平均等待时间)类似于平均每人的等待时间avgrq-sz(平均IO数据)类似于平均每人所买的东西多少%util(磁盘IO使用率)类似于收款台前有人排队的时间比例
可以根据这些数据分析出 I/O 请求的模式,以及 I/O 的速度和响应时间:
- 如果
%util接近100%,说明产生的I/O请求太多,I/O系统已经满负荷,该磁盘可能存在瓶颈 svctm的大小一般和磁盘性能有关,CPU/内存的负荷也会对其有影响,请求过多也会间接导致svctm的增加。await的大小一般取决于服务时间(svctm) 以及 I/O 队列的长度和 I/O 请求的发出模式。一般来说svctm<await,因为同时等待的请求的等待时间被重复计算了。如果svctm比较接近await,说明I/O 几乎没有等待时间- 如果
await远大于svctm,说明I/O队列太长,应用得到的响应时间变慢 - 队列长度(
avgqu-sz)也可作为衡量系统 I/O 负荷的指标,但由于avgqu-sz是按照单位时间的平均值,所以不能反映瞬间的 I/O 洪水。 - 如果响应时间超过了用户可以容许的范围,这时可以考虑更换更快的磁盘,调整内核elevator算法,优化应用,或者升级 CPU。
- 如果
%util很大,而rkB/s和wkB/s很小,一般是因为磁盘存在较多的磁盘随机读写,最好把磁盘随机读写优化成顺序读写。
nfsiostat
使用 iostat -x 命令时没有看到 CFS 文件系统的信息,可能是因为 iostat 命令默认只显示本地设备的信息,而不包括网络文件系统(NFS)等远程文件系统。nfsiostat 是一个专门用于监视 NFS 文件系统的工具,可以显示每个 NFS 服务器的 I/O 使用率和延迟时间等信息。
# nfsiostat 5

11.147.151.12:/log/121 mounted on /var/lib/kubelet/pods/eb7854e4-a01a-4a95-8f6e-ccb761ca0e4d/volumes/kubernetes.io~nfs/friendsvr-121-pv-log:

   op/s         rpc bklog
  35.93    0.00
read:            ops/s             kB/s           kB/op         retrans         avg RTT (ms)    avg exe (ms)
                  0.126   1.496  11.860       0 (0.0%)    2.875   2.945
write:           ops/s             kB/s           kB/op         retrans         avg RTT (ms)    avg exe (ms)
                 11.843 434.621  36.698       0 (0.0%)   12.302  15.766
磁盘IO采集算法
通过/proc/diskstats文件计算得到。
252       0 vda 58964 2845 2864110 163028 56607103 29847638 1634532676 260114388 0 13189912 260253616
252       1 vda1 58883 2407 2859958 162956 55731294 29847638 1634532668 260028636 0 13104408 260168496
252      16 vdb 5743072 3056 239591974 19078076 66105709 19855513 4542946783 973079144 0 30841824 992260604
The /proc/diskstats file displays the I/O statistics of block devices. Each line contains the following 14 fields:
1 - major number
2 - minor mumber
3 - device name
4 - reads completed
5 - reads merged                                        (
6 - sectors read
7 - time spent reading (ms)
8 - writes completed
9 - writes merged
10 - sectors written
11 - time spent writing (ms)
12 - I/Os currently in progress
13 - time spent doing I/Os (ms)
14 - weighted time spent doing I/Os (ms)
/proc/diskstats中每个字段的数值也是从系统启动后一直累加的。我们用delta来表示在时间t内某个字段的增量。
delta(reads merged) = reads merged的值 - t秒前reads merged的值

svctm的计算方式:
delta(time spent doing I/Os) / (delta(reads completed) + delta(writes completed))
信号处理
Signals are very useful feature in linux to send notification from one process to another and from the kernel to the process. Signals are sent in some error cases (accessing wrong memory address, bus error, floating point error, …) and also to inform the user application (timer expired, child process finished, IO is ready, ….)
问题:What happens to a multithreaded Linux process if it gets a signal
Question:
If a Unix (Posix) process receives a signal, a signal handler will run.
What will happen to it in a multithreaded process? Which thread receives the signal?
In my opinion, the signal API should be extended to handle that (i.e. the thread of the signal handler should be able to be determined), but hunting for infos on the net I only found year long flames on the linux kernel mailing list and on different forums. As I understood, Linus’ concept differed from the Posix standard, and first some compat layer was built, but now the Linux follows the posix model.
What is the current state?
Answer:
The entry in POSIX on “Signal Generation and Delivery” in “Rationale: System Interfaces General Information” says
Signals generated for a process are delivered to only one thread. Thus, if more than one thread is eligible to receive a signal, one has to be chosen. The choice of threads is left entirely up to the implementation both to allow the widest possible range of conforming implementations and to give implementations the freedom to deliver the signal to the “easiest possible” thread should there be differences in ease of delivery between different threads.
From the signal(7) manual on a Linux system:
A signal may be generated (and thus pending) for a process as a whole (e.g., when sent using
kill(2)) or for a specific thread (e.g., certain signals, such asSIGSEGVandSIGFPE, generated as a consequence of executing a specific machine-language instruction are thread directed, as are signals targeted at a specific thread usingpthread_kill(3)). A process-directed signal may be delivered to any one of the threads that does not currently have the signal blocked. If more than one of the threads has the signal unblocked, then the kernel chooses an arbitrary thread to which to deliver the signal.
And in pthreads(7):
Threads have distinct alternate signal stack settings. However, a new thread’s alternate signal stack settings are copied from the thread that created it, so that the threads initially share an alternate signal stack (fixed in kernel 2.6.16).
From the pthreads(3) manual on an OpenBSD system (as an example of an alternate approach):
Signals handlers are normally run on the stack of the currently executing thread.
(I’m currently not aware of how this is handled when multiple threads are executing concurrently on a multi-processor machine)
The older LinuxThread implementation of POSIX threads only allowed distinct single threads to be targeted by signals. From pthreads(7) on a Linux system:
LinuxThreads does not support the notion of process-directed signals: signals may be sent only to specific threads.
Extending the accepted answer, there is a more practical view, what I found here - LINUX – HANDLING SIGNALS IN A MULTITHREADED APPLICATION
The essence is the following:
Signal handlers are per-process, but signal masks are per-thread.
-
Thus, if we install/uninstall a signal handler (with signal() or sigaction()) on any thread, it will affect all of them.
-
If a process gets a signal, the handler will be executed only on a single thread. This thread is pseudo-randomly selected among them, whose signal mask accepts it. My experiments show that it is always the thread with the least pid. (Comment says it might by also the thread created first. Both would match the posix standard, so do not trust it in your code.)
-
Signals sent to any thread are considered as signal sent to the main process. Thus, if a thread gets a signal, it is quite possible that an other thread will execute the handler. Best if we see that as if threads (identified by tids, thread ids) would be considered as masked processes (identified by pids), and signals sent to a tid would be forwarded to their pid.
-
For the execution of a signal handler, in its signal mask the given signal number is automatically masked. This is to prevent stacked signal handler execution in a signal burst. This can be changed with the
SA_NODEFERflag of thesigaction(...)call. -
(3) and (4) results that in the case of a signal burst, the system distributes the signal handlers possibly most parallelly.
-
However, if we have set up the sigaction with
SA_NODEFER, always the same thread will get the signal and they will stack.
测试程序:LINUX – HANDLING SIGNALS IN A MULTITHREADED APPLICATION
The signal context
While a signal arrives on a single threaded process, the thread complete the current instruction, jump to the signal handler and return when it finish.
Signal handlers are per process, signal masks are per thread
On a multithreaded application – the signal handler execute in one of the thread contexts. We can’t predict the thread that will be chosen to run the signal handler:
测试程序:
#include<stdio.h>
#include<unistd.h>
#include<pthread.h>
#include <sys/mman.h>
#include <stdlib.h>
#include <sys/prctl.h>
#include <sys/types.h>
#include <sys/wait.h>
#include <sys/stat.h>
#include <fcntl.h>
#include <sys/ioctl.h>

void *threadfn1(void *p)
{
	while(1){
		printf("thread1\n");
		sleep(2);
	}
	return 0;
}

void *threadfn2(void *p)
{
	while(1){
		printf("thread2\n");
		sleep(2);
	}
	return 0;
}

void *threadfn3(void *p)
{
	while(1){
		printf("thread3\n");
		sleep(2);
	}
	return 0;
}


void handler(int signo, siginfo_t *info, void *extra)
{
	int i;
	for(i=0;i<10;i++)
	{
		puts("signal");
		sleep(2);
	}
}

void set_sig_handler(void)
{
    struct sigaction action;


    action.sa_flags = SA_SIGINFO;
    action.sa_sigaction = handler;

    if (sigaction(SIGRTMIN + 3, &action, NULL) == -1) {
        perror("sigusr: sigaction");
        _exit(1);
    }

}

int main()
{
	pthread_t t1,t2,t3;
	set_sig_handler();
	pthread_create(&t1,NULL,threadfn1,NULL);
	pthread_create(&t2,NULL,threadfn2,NULL);
	pthread_create(&t3,NULL,threadfn3,NULL);
	pthread_exit(NULL);
	return 0;
}
Compile and run the app, you will see periodic output for each thread:
thread1
thread2
thread3
thread1
thread2
thread3
...
Now send a signal to the process using the kill command:
# kill -37 [pid]
The kernel choose one thread and run the signal handler in its context. In my case thread 1 selected so the output for 10 times is:
signal
thread2
thread3
signal
thread2
thread3
...
This behaviour can be problematic in case the selected thread is an important task.
(Note that if the signal is an exception (SIGSEGV, SIGFPE, SIGBUS, SIGILL, …) the signal will be caught by the thread doing the exception)
We can’t choose the selected thread but we can do a little trick to hack the system to choose the thread we want. The trick is to block the signal on all threads except one thread – the one we want to run the signal in:
#include<stdio.h>
#include<unistd.h>
#include<pthread.h>
#include <sys/mman.h>
#include <stdlib.h>
#include <sys/prctl.h>
#include <sys/types.h>
#include <sys/wait.h>
#include <sys/stat.h>
#include <fcntl.h>
#include <sys/ioctl.h>

void mask_sig(void)
{
    sigset_t mask;
    sigemptyset(&mask);
    sigaddset(&mask, SIGRTMIN+3);

    pthread_sigmask(SIG_BLOCK, &mask, NULL);

}

void *threadfn1(void *p)
{
	mask_sig();
	while(1){
		printf("thread1\n");
		sleep(2);
	}
	return 0;
}

void *threadfn2(void *p)
{
	mask_sig();
	while(1){
		printf("thread2\n");
		sleep(2);
	}
	return 0;
}

void *threadfn3(void *p)
{
	while(1){
		printf("thread3\n");
		sleep(2);
	}
	return 0;
}


void handler(int signo, siginfo_t *info, void *extra)
{
	int i;
	for(i=0;i<10;i++)
	{
		puts("signal");
		sleep(2);
	}
}

void set_sig_handler(void)
{
    struct sigaction action;


    action.sa_flags = SA_SIGINFO;
    action.sa_sigaction = handler;

    if (sigaction(SIGRTMIN + 3, &action, NULL) == -1) {
        perror("sigusr: sigaction");
        _exit(1);
    }

}

int main()
{
	pthread_t t1,t2,t3;
	set_sig_handler();
	pthread_create(&t1,NULL,threadfn1,NULL);
	pthread_create(&t2,NULL,threadfn2,NULL);
	pthread_create(&t3,NULL,threadfn3,NULL);
	pthread_exit(NULL);
	return 0;
}
We block the signal on threads 1,2 so the system will deliver the signal to thread 3
Run the app, send the signal with kill command. The output:
signal
thread1
thread2
signal
thread1
thread2
...
Another trick is to create a thread for signal handling that will be blocked using sigwait , waiting for signal.
Behind the scenes
Inside the kernel, each thread has a task_struct object defines in sched.h:
All the signals fields are stored per thread. Actually , there is no structure for the process , all the threads on the same process points to the same memory and files tables so the kernel need to choose a thread to deliver the signal to:
struct task_struct {
#ifdef CONFIG_THREAD_INFO_IN_TASK
	/*
	 * For reasons of header soup (see current_thread_info()), this
	 * must be the first element of task_struct.
	 */
	struct thread_info		thread_info;
#endif
	/* -1 unrunnable, 0 runnable, >0 stopped: */
	volatile long			state;
...
...
...
	/* Signal handlers: */
	struct signal_struct		*signal;
	struct sighand_struct		*sighand;
	sigset_t			blocked;
	sigset_t			real_blocked;
	/* Restored if set_restore_sigmask() was used: */
	sigset_t			saved_sigmask;
	struct sigpending		pending;
	unsigned long			sas_ss_sp;
	size_t				sas_ss_size;
	unsigned int			sas_ss_flags;
...
...
}
Sending signals to a thread
Another option is to use pthread_kill(3) to send a signal directly to a thread. This can be done only in the same process. For example:
#include<stdio.h>
#include<unistd.h>
#include<pthread.h>
#include <sys/mman.h>
#include <stdlib.h>
#include <sys/prctl.h>
#include <sys/types.h>
#include <sys/wait.h>
#include <sys/stat.h>
#include <fcntl.h>
#include <sys/ioctl.h>


void *threadfn1(void *p)
{
	while(1){
		printf("thread1\n");
		sleep(2);
	}
	return 0;
}

void *threadfn2(void *p)
{
	while(1){
		printf("thread2\n");
		sleep(2);
	}
	return 0;
}

void *threadfn3(void *p)
{
	while(1){
		printf("thread3\n");
		sleep(2);
	}
	return 0;
}


void handler(int signo, siginfo_t *info, void *extra)
{
	int i;
	for(i=0;i<5;i++)
	{
		puts("signal");
		sleep(2);
	}
}

void set_sig_handler(void)
{
    struct sigaction action;


    action.sa_flags = SA_SIGINFO;
    action.sa_sigaction = handler;

    if (sigaction(SIGRTMIN + 3, &action, NULL) == -1) {
        perror("sigusr: sigaction");
        _exit(1);
    }
}

int main()
{
	pthread_t t1,t2,t3;
	set_sig_handler();
	pthread_create(&t1,NULL,threadfn1,NULL);
	pthread_create(&t2,NULL,threadfn2,NULL);
	pthread_create(&t3,NULL,threadfn3,NULL);
	sleep(3);
	pthread_kill(t1,SIGRTMIN+3);
	sleep(15);
	pthread_kill(t2,SIGRTMIN+3);
	pthread_kill(t3,SIGRTMIN+3);
	pthread_exit(NULL);
	return 0;
}
We start with creating 3 threads, then we send a signal to thread 1, wait for the signal handler to finish then send signals both to threads 2 and 3 , they will run the signal handler at the same time so in this case we will see :
signal
signal
thread1
...
Linux/UNIX Programming Interface
clock_getres/clock_gettime/clock_settime
#include <time.h>

int clock_getres(clockid_t clk_id, struct timespec *res);
int clock_gettime(clockid_t clk_id, struct timespec *tp);
int clock_settime(clockid_t clk_id, const struct timespec *tp);
The function clock_getres() finds the resolution (precision) of the specified clock clk_id, and, if res is non-NULL, stores it in the struct timespec pointed to by res. The resolution of clocks depends on the implementation and cannot be configured by a particular process. If the time value pointed to by the argument tp of clock_settime() is not a multiple of res, then it is truncated to a multiple of res.
The functions clock_gettime() and clock_settime() retrieve and set the time of the specified clock clk_id.
The res and tp arguments are timespec structs, as specified in <time.h>:
struct timespec {
        time_t   tv_sec;        /* seconds */
        long     tv_nsec;       /* nanoseconds */
};
The clk_id argument is the identifier of the particular clock on which to act. A clock may be system-wide and hence visible for all processes, or per-process if it measures time only within a single process.
- https://linux.die.net/man/3/clock_gettime
pthread_setname_np
#define _GNU_SOURCE             /* See feature_test_macros(7) */
#include <pthread.h>

int pthread_setname_np(pthread_t thread, const char *name);
int pthread_getname_np(pthread_t thread, char *name, size_t len);
By default, all the threads created using pthread_create() inherit the program name. The pthread_setname_np() function can be used to set a unique name for a thread, which can be useful for debugging multithreaded applications. The thread name is a meaningful C language string, whose length is restricted to 16 characters, including the terminating null byte (‘\0’). The thread argument specifies the thread whose name is to be changed; name specifies the new name.
pthread_setname_np() internally writes to the thread-specific comm file under the /proc filesystem: /proc/self/task/[tid]/comm.
Note: These functions are nonstandard GNU extensions; hence the suffix “_np” (nonportable) in the names.
pthread_kill
#include <signal.h>
int pthread_kill(pthread_t thread, int sig);
The pthread_kill() function sends the signal sig to thread, a thread in the same process as the caller. The signal is asynchronously directed to thread. If sig is 0, then no signal is sent, but error checking is still performed.
POSIX.1-2008 recommends that if an implementation detects the use of a thread ID after the end of its lifetime, pthread_kill() should return the error ESRCH. The glibc implementation returns this error in the cases where an invalid thread ID can be detected.
malloc_trim
#include <malloc.h>
int malloc_trim(size_t pad);
malloc_trim function attempts to release free memory from the heap (by calling sbrk(2) or madvise(2) with suitable arguments). This function is a GNU extension.
The pad argument specifies the amount of free space to leave untrimmed at the top of the heap. If this argument is 0, only the minimum amount of memory is maintained at the top of the heap (i.e., one page or less). A nonzero argument can be used to maintain some trailing space at the top of the heap in order to allow future allocations to be made without having to extend the heap with sbrk(2).
madvise
#include <sys/mman.h>
int madvise(void *addr, size_t length, int advice);
The madvise() system call is used to give advice or directions to the kernel about the address range beginning at address addr and with size length bytes In most cases, the goal of such advice is to improve system or application performance.
std::thread::hardware_concurrency
// Returns the number of concurrent threads supported by the implementation. The value should be considered only a hint.
static unsigned int hardware_concurrency() noexcept; // (since C++11)
std::thread::hardware_concurrency() is a static member function of the std::thread class in C++11 and later. It returns an unsigned int value representing the number of hardware thread contexts available on the current system.
Purpose:
It provides a hint to the programmer about the optimal(最佳的) number of concurrent threads that the hardware can effectively execute in parallel. This can be useful for determining the number of threads to create in a thread pool or parallel algorithm.
Interpretation:
The returned value typically corresponds to the number of logical CPU cores, including those provided by technologies like hyperthreading or SMT (Simultaneous Multithreading).
Hint, Not a Guarantee:
It is important to note that the value returned by hardware_concurrency() is a hint and not a strict guarantee. The actual number of threads that can run truly in parallel can be influenced by various factors, including operating system scheduling, other running processes, and the nature of the workload.
#include <iostream>
#include <thread>

int main()
{
    unsigned int num_threads = std::thread::hardware_concurrency();
    if (num_threads > 0) {
        std::cout << "Hardware supports " << num_threads << " concurrent threads.\n";
    } else {
        std::cout << "Hardware concurrency information not available.\n";
    }
    return 0;
}
问题定位
top (display Linux processes)
| 常用命令 | 含义 | 备注 |
|---|---|---|
| Z,B,E,e | Global: ‘Z’ colors; ‘B’ bold; ‘E’/’e’ summary/task memory scale | 显示相关的设置 |
| l,t,m | Toggle Summary: ‘l’ load avg; ‘t’ task/cpu stats; ‘m’ memory info | 最顶部的三部分信息切换(Toggle):负载,cpu,memory |
| 0,1,2,3,I | Toggle: ‘0’ zeros; ‘1/2/3’ cpus or numa node views; ‘I’ Irix mode | 查看cpu,numa node |
| f,F,X | Fields: ‘f’/’F’ add/remove/order/sort; ‘X’ increase fixed-width | 设置显示哪些 fields |
| L,&,<,> | Locate: ‘L’/’&’ find/again; Move sort column: ‘<’/’>’ left/right | 字符串查找,通过左右健移动查看 |
| R,H,V,J | Toggle: ‘R’ Sort; ‘H’ Threads; ‘V’ Forest view; ‘J’ Num justify | 查看线程 |
| c,i,S,j | Toggle: ‘c’ Cmd name/line; ‘i’ Idle; ‘S’ Time; ‘j’ Str justify | 查看程序命令行参数 |
| x,y | Toggle highlights: ‘x’ sort field; ‘y’ running tasks | |
| z,b | Toggle: ‘z’ color/mono; ‘b’ bold/reverse (only if ‘x’ or ‘y’) | 切换颜色 |
| u,U,o,O | Filter by: ‘u’/’U’ effective/any user; ‘o’/’O’ other criteria | 按用户过滤 |
| n,#,^O | Set: ‘n’/’#’ max tasks displayed; Show: Ctrl+’O’ other filter(s) | 设置显示 task 的数量 |
| C,… | Toggle scroll coordinates msg for: up,down,left,right,home,end | |
| k,r | Manipulate tasks: ‘k’ kill; ‘r’ renice | 向进程发送信号,调整进程优先级 |
| d or s | Set update interval | 设置更新频率 |
| W,Y | Write configuration file ‘W’; Inspect other output ‘Y’ | 保存配置文件 $HOME/.toprc |
| q | Quit | 退出 |
More: man top
循环记录某个进程的 CPU 使用率符合某个条件时,输出这个进程所有线程的堆栈信息
#!/bin/bash

# @brief 循环记录某个进程的 cpu 使用率符合某个条件时,输出这个进程所有线程的堆栈信息
# @note 需要 root 执行权限

process_name="gamesvr"
cpu_usage=60

# 循环执行任务,直到程序停止
while :; do
    # 通过 top 命令获取当前正在运行的进程,并通过 pgrep 命令过滤出 process_name 进程
    for pid in $(top -p $(pgrep -f $process_name) -d 1 -bn2 | tail -1 | awk '$9 < $cpu_usage { print $1 }'); do
        # 获取进程的启动时间
        echo "${pid} `date`"

        # 遍历该进程的子进程
        for dir in /proc/$pid/task/*; do
            # 获取进程的详细信息,包括进程名称和进程 ID
            echo "${dir##*/} ($(cat $dir/comm))"

            # 打印进程的栈信息
            cat $dir/stack

            # 打印当前进程的详细信息
            echo
        done
    done

    # 等待一段时间再继续检测
    sleep 10
done
监控某个进程每隔 N 秒刷新一次,共刷新 M 次,并将输出重定向到 top.log 文件中
#!/bin/bash

top -Hp 3668452 -d 0.5 -n 3 -b > top.log
-Hp 3668452:-H 参数表示以线程模式运行,-p 参数表示只显示指定进程的信息。在这里,3668452 是进程ID,所以这个命令将只显示进程ID为 3668452 的进程的线程信息。-d 0.5:-d 参数表示刷新间隔。在这里,0.5 表示每隔 0.5 秒刷新一次。-n 3:-n 参数表示刷新次数。在这里,3 表示刷新 3 次。-b:-b 参数表示批处理模式。在这种模式下,top 将不会进入交互模式,而是在完成指定次数的刷新后退出。> top.log:将 top 命令的输出重定向到名为 top.log 的文件中。
这个命令的作用是:以线程模式查看进程ID为 3668452 的进程信息,每隔 0.5 秒刷新一次,共刷新 3 次,并将输出重定向到 top.log 文件中。
dmesg
dmesg is used to examine or control the kernel ring buffer. The default action is to display all messages from the kernel ring buffer.
# 显示可读时间, 定位内存异常错误
$dmesg -T

[Sun Dec 13 23:41:22 2020] Out of memory: Kill process 15395 (cc1plus) score 7 or sacrifice child
[Sun Dec 13 23:41:22 2020] Killed process 15395 (cc1plus) total-vm:168940kB, anon-rss:119492kB, file-rss:0kB
strace (relies on ptrace system call)
strace is a common tool upon many GNU/Linux systems. Put simply strace is a “system call tracer” - which is where it gets its name from. Using strace, as root, you can monitor the system calls made by any process upon your system. This can be enormously beneficial when you have a misbehaving program.
strace(strace - trace system calls and signals)能够跟踪进程使用的系统调用,并显示其内容。因此,当遇到调试不明的故障时,首先使用 strace 找出系统调用中出错的地方,通常能得到故障发生的线索,特别是与文件有关的错误、参数错误等。
注意:使用 strace 能够有效地发现系统调用失败有关的故障,但无法发现用户写出的程序或共享库中发生的错误。
strace/ltrace 是一类不错的工具,在工作中经常会用到,其主要可以用于:
- 了解一个程序的工作原理(可以了解 Linux 下很多常用的命令实现的原理)
- 帮助定位程序中的问题(在开发工作时帮助定位问题)
strace 和 ltrace 的区别:
strace —— Trace system calls and signals (跟踪一个进程的系统调用或信号产生的情况)
ltrace —— A library call tracer (跟踪进程调用库函数的情况)
- strace 最初是为 SunOS 系统编写的,ltrace 最早出现在 GUN/Debian Linux 中,这两个工具现在已被移植到了大部分 Unix 系统中(可以通过 which 命令查找系统中是否存在此命令),大多数 Linux 发行版都自带了 strace 和 ltrace,没有的话也可以尝试手动安装它们。
- 关于系统调用和库函数的区别,APUE 第一章有详细的介绍。
- strace 和 ltrace 的使用方法基本相同。其中它们共同最常用的三个命令行参数是:
| 选项 | 功能 |
|---|---|
| -f | 除了跟踪当前进程外,还跟踪其子进程 |
| -o file | 将输出信息写到文件 file 中,而不是显示到标准错误输出(stderr) |
| -p PID | 绑定到一个由 PID 对应的正在运行的进程,此参数常用来调试后台进程(守护进程) |
- strace 和 ltrace 的输出结果格式基本相似。以 strace 为例,每一行都是一条系统调用(ltrace 为库函数),等号左边是系统调用的函数名及其参数,右边是该调用的返回值。
- 此类工具的原理是也大同小异,都是使用 ptrace 系统调用跟踪调试运行中的进程。
- 用调试工具实时跟踪程序的运行情况,不仅是诊断软件“疑难杂症”的有效手段,也可以帮助我们理清程序的“脉络”,即快速掌握软件的运行流程和工作原理,不失为一种学习源代码的辅助方法。
使用示例:
#include<stdio.h>
#include<stdlib.h>

int main()
{
    FILE *fp;
    fp = fopen("/etc/shadow", "r");
    if (fp == NULL)
    {
        printf("Error!\n");
        return EXIT_FAILURE;
    }
    return EXIT_SUCCESS;
}
/*
gcc -Wall -g -o st1 st1.c
$ ./st1
Error!
*/
执行该程序报错是因为程序试图打开一般用户没有读权限的 /etc/shadow 文件,但是通过错误消息无法得知这一点。真实的程序也会有错误信息内容不明确、所有地方都显示同样的错误信息的情况,甚至可能什么都不显示。这种情况下,就很难确定错误发生在源代码的什么地方(通过日志信息可以知道最上层调用出错的地方),因此也无法用 GDB 设置断点,此时可以使用 strace 来进一步定位错误。
$ strace ./st1

execve("./st1", ["./st1"], [/* 59 vars */]) = 0
brk(0)                                  = 0x804a000
mmap2(NULL, 4096, PROT_READ|PROT_WRITE, MAP_PRIVATE|MAP_ANONYMOUS, -1, 0) = 0xb7fc4000
access("/etc/ld.so.preload", R_OK)      = -1 ENOENT (No such file or directory)
open("/etc/ld.so.cache", O_RDONLY)      = 3
fstat64(3, {st_mode=S_IFREG|0644, st_size=37293, ...}) = 0
mmap2(NULL, 37293, PROT_READ, MAP_PRIVATE, 3, 0) = 0xb7fba000
close(3)                                = 0
open("/lib/libc.so.6", O_RDONLY)        = 3							// (1)
read(3, "\177ELF\1\1\1\0\0\0\0\0\0\0\0\0\3\0\3\0\1\0\0\0\340Y\1"..., 512) = 512
fstat64(3, {st_mode=S_IFREG|0755, st_size=1548470, ...}) = 0
mmap2(NULL, 1312188, PROT_READ|PROT_EXEC, MAP_PRIVATE|MAP_DENYWRITE, 3, 0) = 0xb7e79000
madvise(0xb7e79000, 1312188, MADV_SEQUENTIAL|0x1) = 0
mmap2(0xb7fb3000, 16384, PROT_READ|PROT_WRITE, MAP_PRIVATE|MAP_FIXED|MAP_DENYWRITE, 3, 0x139) = 0xb7fb3000
mmap2(0xb7fb7000, 9660, PROT_READ|PROT_WRITE, MAP_PRIVATE|MAP_FIXED|MAP_ANONYMOUS, -1, 0) = 0xb7fb7000
close(3)                                = 0
mmap2(NULL, 4096, PROT_READ|PROT_WRITE, MAP_PRIVATE|MAP_ANONYMOUS, -1, 0) = 0xb7e78000
set_thread_area({entry_number:-1 -> 6, base_addr:0xb7e786b0, limit:1048575, seg_32bit:1, contents:0, read_exec_only:0, limit_in_pages:1, seg_not_present:0, useable:1}) = 0
mprotect(0xb7fb3000, 8192, PROT_READ)   = 0
munmap(0xb7fba000, 37293)               = 0
brk(0)                                  = 0x804a000
brk(0x806b000)                          = 0x806b000
open("/etc/shadow", O_RDONLY)           = -1 EACCES (Permission denied)	// (2)
fstat64(1, {st_mode=S_IFCHR|0620, st_rdev=makedev(136, 0), ...}) = 0
mmap2(NULL, 4096, PROT_READ|PROT_WRITE, MAP_PRIVATE|MAP_ANONYMOUS, -1, 0) = 0xb7fc3000
write(1, "Error!\n", 7Error!										// (3)
)                 = 7
exit_group(1)                           = ?
Process 22259 detached
出错并结束的话,从后往前看 strace 的输出结果是解决问题的捷径。从标注的位置可以发现,最后即为在界面上显示错误信息的系统调用,再往前看,系统调用 open() 失败,而且立即可以得知程序在试图打开 /etc/shadow 时发生了 Permission denied错误(EACCES)。
上面 strace 显示的信息有很多,但开头的信息都是关于启动进程时的处理。尽管这一部分有很多错误,但这些错误是进程在试图从各种路径中加载共享库而导致的。从 open(“/lib/libc.so.6”,O_RDONLY) = 3 处开始的十几行,程序成功地将所有的库链接到了进程,附近都是运行时加载器(runtime loader)的处理,可以忽略。
使用 strace 的各种选项 —— 进一步帮助定位问题
-i 找到地址方便 GDB 详细调试
Print the instruction pointer at the time of the system call. 给 strace 添加 -i 选项即可显示程序在哪个地址进行了系统调用,可以将该地址作为断点使用,然后使用 GDB 进一步定位问题。各行开头 [] 中的数字就是执行系统调用的代码的地址。在 GDB 中可以指定该地址并显示 backstrace,例如:b *0xb7e44d2a
$ strace -i ./st1

[b7e44d2a] execve("./st1", ["./st1"], [/* 59 vars */]) = 0
[b7fdf6bb] brk(0)                       = 0x804a000
[b7fe04c3] mmap2(NULL, 4096, PROT_READ|PROT_WRITE, MAP_PRIVATE|MAP_ANONYMOUS, -1, 0) = 0xb7fcb000
[b7fe0041] access("/etc/ld.so.preload", R_OK) = -1 ENOENT (No such file or directory)
[b7fdff04] open("/etc/ld.so.cache", O_RDONLY) = 3
[b7fdfece] fstat64(3, {st_mode=S_IFREG|0644, st_size=37293, ...}) = 0
[b7fe04c3] mmap2(NULL, 37293, PROT_READ, MAP_PRIVATE, 3, 0) = 0xb7fc1000
[b7fdff3d] close(3)                     = 0
[b7fdff04] open("/lib/libc.so.6", O_RDONLY) = 3
[b7fdff84] read(3, "\177ELF\1\1\1\0\0\0\0\0\0\0\0\0\3\0\3\0\1\0\0\0\340Y\1"..., 512) = 512
[b7fdfece] fstat64(3, {st_mode=S_IFREG|0755, st_size=1548470, ...}) = 0
[b7fe04c3] mmap2(NULL, 1312188, PROT_READ|PROT_EXEC, MAP_PRIVATE|MAP_DENYWRITE, 3, 0) = 0xb7e80000
[b7fe0584] madvise(0xb7e80000, 1312188, MADV_SEQUENTIAL|0x1) = 0
[b7fe04c3] mmap2(0xb7fba000, 16384, PROT_READ|PROT_WRITE, MAP_PRIVATE|MAP_FIXED|MAP_DENYWRITE, 3, 0x139) = 0xb7fba000
[b7fe04c3] mmap2(0xb7fbe000, 9660, PROT_READ|PROT_WRITE, MAP_PRIVATE|MAP_FIXED|MAP_ANONYMOUS, -1, 0) = 0xb7fbe000
[b7fdff3d] close(3)                     = 0
[b7fe04c3] mmap2(NULL, 4096, PROT_READ|PROT_WRITE, MAP_PRIVATE|MAP_ANONYMOUS, -1, 0) = 0xb7e7f000
[b7fcdce0] set_thread_area({entry_number:-1 -> 6, base_addr:0xb7e7f6b0, limit:1048575, seg_32bit:1, contents:0, read_exec_only:0, limit_in_pages:1, seg_not_present:0, useable:1}) = 0
[b7fe0544] mprotect(0xb7fba000, 8192, PROT_READ) = 0
[b7fe0501] munmap(0xb7fc1000, 37293)    = 0
[b7f3855b] brk(0)                       = 0x804a000
[b7f3855b] brk(0x806b000)               = 0x806b000
[b7f304be] open("/etc/shadow", O_RDONLY) = -1 EACCES (Permission denied)
[b7f2f57e] fstat64(1, {st_mode=S_IFCHR|0620, st_rdev=makedev(136, 0), ...}) = 0
[b7f3c5f3] mmap2(NULL, 4096, PROT_READ|PROT_WRITE, MAP_PRIVATE|MAP_ANONYMOUS, -1, 0) = 0xb7fca000
[b7f30b8e] write(1, "Error!\n", 7Error!
)      = 7
[b7f0bcf3] exit_group(1)                = ?
Process 17355 detached
-p PID (或 -p pidof ProcName) attach 到进程上调试后台程序
Attach to the process with the process ID pid and begin tracing. The trace may be terminated at any time by a keyboardinterrupt signal (CTRL-C). strace will respond by detaching itself from the traced process(es) leaving it (them) to continue running. Multiple -p optionscan be used to attach to up to 32 processes in addition to command (which is optional if at least one -p option is given).
此选项主要用于查看运行中的进程(如守护进程)的行为。将上面的程序做一下修改:
#include<stdio.h>
#include<stdlib.h>
#include<unistd.h>

int main()
{
    while(1)
    {
        FILE *fp;
        fp = fopen("/etc/shadow", "r");
        if (fp == NULL)
        {
            printf("Error!\n");
            //return EXIT_FAILURE;
        }
        else
        {
            fclose(fp);
        }

        sleep(3);// sleep 3 seconds
    }

    return EXIT_SUCCESS;
}
/*
   gcc -Wall -g -o st1 st1_p260.c
*/
ps ux | grep st1
1006    17673  0.0  0.0   1640  348 pts/0    S+   10:21  0:00 ./st1
使用 -p 选项跟踪当前正在运行的程序,按 Ctrl-C 键来结束程序。
$ strace -p 17673

Process 17673 attached - interrupt to quit
restart_syscall(<... resuming interrupted call ...>) = 0
open("/etc/shadow", O_RDONLY)           = -1 EACCES (Permission denied)
write(1, "Error!\n", 7)                 = 7
rt_sigprocmask(SIG_BLOCK, [CHLD], [], 8) = 0
rt_sigaction(SIGCHLD, NULL, {SIG_DFL}, 8) = 0
rt_sigprocmask(SIG_SETMASK, [], NULL, 8) = 0
nanosleep({3, 0}, {3, 0})               = 0
open("/etc/shadow", O_RDONLY)           = -1 EACCES (Permission denied)
write(1, "Error!\n", 7)                 = 7
rt_sigprocmask(SIG_BLOCK, [CHLD], [], 8) = 0
rt_sigaction(SIGCHLD, NULL, {SIG_DFL}, 8) = 0
rt_sigprocmask(SIG_SETMASK, [], NULL, 8) = 0
nanosleep({3, 0}, {3, 0})               = 0
open("/etc/shadow", O_RDONLY)           = -1 EACCES (Permission denied)
write(1, "Error!\n", 7)                 = 7
rt_sigprocmask(SIG_BLOCK, [CHLD], [], 8) = 0
rt_sigaction(SIGCHLD, NULL, {SIG_DFL}, 8) = 0
rt_sigprocmask(SIG_SETMASK, [], NULL, 8) = 0
nanosleep({3, 0},  <unfinished ...>
Process 17673 detached

// 或者使用

$ strace -p `pidof st1`

Process 17673 attached - interrupt to quit
restart_syscall(<... resuming interrupted call ...>) = 0
open("/etc/shadow", O_RDONLY)           = -1 EACCES (Permission denied)
write(1, "Error!\n", 7)                 = 7
rt_sigprocmask(SIG_BLOCK, [CHLD], [], 8) = 0
rt_sigaction(SIGCHLD, NULL, {SIG_DFL}, 8) = 0
rt_sigprocmask(SIG_SETMASK, [], NULL, 8) = 0
nanosleep({3, 0}, {3, 0})               = 0
open("/etc/shadow", O_RDONLY)           = -1 EACCES (Permission denied)
write(1, "Error!\n", 7)                 = 7
rt_sigprocmask(SIG_BLOCK, [CHLD], [], 8) = 0
rt_sigaction(SIGCHLD, NULL, {SIG_DFL}, 8) = 0
rt_sigprocmask(SIG_SETMASK, [], NULL, 8) = 0
nanosleep({3, 0},  <unfinished ...>
Process 17673 detached
-o output.log 将 strace 信息输出到文件方便进一步查找
Write the trace output to the file filename rather than to stderr. Use filename.pid if -ff is used. If the argument begins with | or with ! then the rest of the argument is treated as a command and all output is piped to it. This is convenient for piping the debugging output to a program without affecting the redirections of executed programs.
-ff: If the -o filename option is in effect, each processes trace is written to filename.pid where pid is the numeric process id of each process.
$ strace -o output.log ./st1
$ cat output.log
execve("./st1", ["./st1"], [/* 59 vars */]) = 0
brk(0)                                  = 0x804a000
mmap2(NULL, 4096, PROT_READ|PROT_WRITE, MAP_PRIVATE|MAP_ANONYMOUS, -1, 0) = 0xb7f2e000
access("/etc/ld.so.preload", R_OK)      = -1 ENOENT (No such file or directory)
注意:strace 的输出为标准错误输出,因此可以像下面这样将显示内容输出到标准输出上,通过管道再传给 grep、less 等。
$ strace ./st1 2>&1 | grep open

open("/etc/ld.so.cache", O_RDONLY)      = 3
open("/lib/libc.so.6", O_RDONLY)        = 3
open("/etc/shadow", O_RDONLY)           = -1 EACCES (Permission denied)
open("/etc/shadow", O_RDONLY)           = -1 EACCES (Permission denied)
open("/etc/shadow", O_RDONLY)           = -1 EACCES (Permission denied)
open("/etc/shadow", O_RDONLY)           = -1 EACCES (Permission denied)
2>&1   将标准出错重定向到标准输出
2>     代表错误重定向
&1     代表标准输出
-f 跟踪 fork 之后的子进程
Trace child processes as they are created by currently traced processes as a result of the fork(2) system call. The new process is attached to as soon as its pid is known (through the return value of fork(2) in the parent process).This means that such children may run uncontrolled for a while (especially in the case of a vfork(2)), until the parent is scheduled again to complete its (v)fork(2) call. If the parent process decides to wait(2) for achild that is currently being traced, it is suspended until an appropriate child process either terminates or incurs a signal that would cause it to terminate (as determined from the child’s current signal disposition).
-t / -tt 显示系统调用的执行时刻
-t    以秒为单位
-tt   以微秒为单位
-T    显示系统调用的耗时

-t         Prefix each line of the trace with the time of day.
-tt        If given twice, the time printedwill include the microseconds.
-ttt       If given thrice, the time printed will include the microseconds and the leading portion will be printed as the number of seconds since the epoch.
-T         Show the time spent in system calls. This records the time difference between the beginning and the end of each system call.
-e 显示指定跟踪的系统调用
-e expr

A qualifying expression which modifies which events to trace or how to trace them. The format of the expression is:

[qualifier=][!]value1[,value2]...

where qualifier is one of trace, abbrev, verbose, raw, signal, read, or write and value is  a qualifier-dependent symbol or number. **The default qualifier is trace**. Using an exclamation mark negates the set of values. For example, `-e open` means literally `-etrace=open` which in turn means trace only the `open` system call. By contrast, `-etrace=!open` means to trace every system call except open. In addition, the special values all and none have the obvious meanings.

Note that some shells use the exclamation point for history expansion even inside quoted arguments. If so, you must escape the exclamation point with a backslash.
- -e trace=all 跟踪进程的所有系统调用
- -e trace=network 只记录和网络 api 相关的系统调用
- -e trace=file 只记录涉及到文件名的系统调用
- -e trace=desc 只记录涉及到文件句柄的系统调用
- 其他的还包括:process, ipc, signal 等
只记录 open 的系统调用:
$ strace -e trace=open ./st1

open("/etc/ld.so.cache", O_RDONLY)      = 3
open("/lib/libc.so.6", O_RDONLY)        = 3
open("/etc/shadow", O_RDONLY)           = -1 EACCES (Permission denied)
Error!
open("/etc/shadow", O_RDONLY)           = -1 EACCES (Permission denied)
Error!
-s 指定系统调用参数的长度
显示系统调用参数时,对于字符串显示的长度, 默认是 32,如果字符串参数很长,很多信息显示不出来。
-s strsize: Specify the maximum string size to print(the default is 32). Note that filenames are not considered strings and arealways printed in full.
例如:
strace -s 1024 ./st1
用 strace 了解程序的工作原理
问题:在进程内打开一个文件,都有唯一一个文件描述符(fd: file descriptor)与这个文件对应。如果已知一个 fd,如何获取这个 fd 所对应文件的完整路径?不管是 Linux、FreeBSD 或其他 Unix 系统都没有提供这样的 API,那怎么办呢?
我们换个角度思考:Unix 下有没有什么命令可以获取进程打开了哪些文件?使用 lsof 命令即可以知道程序打开了哪些文件,也可以了解一个文件被哪个进程打开。(平时工作中很常用,例如,使用 lsof -p PID 来查找某个进程存放的位置)
#include<stdio.h>
#include<unistd.h>
#include<sys/types.h>
#include<sys/stat.h>
#include<fcntl.h>

int main()
{
    open("wcdj", O_CREAT|O_RDONLY);// open file foo
    sleep(1200);// sleep 20 mins 方便调试

    return 0;
}
/*
gcc -Wall -g -o testlsof testlsof.c
./testlsof &
*/
$ gcc -Wall -g -o testlsof testlsof.c
$ ./testlsof &
[1] 12371
$ strace -o lsof.strace lsof -p 12371
COMMAND    PID      USER   FD   TYPE DEVICE    SIZE    NODE NAME
testlsof 12371 gerryyang  cwd    DIR    8,4    4096 2359314 /data/home/gerryyang/test/HACK
testlsof 12371 gerryyang  rtd    DIR    8,1    4096       2 /
testlsof 12371 gerryyang  txt    REG    8,4    7739 2359364 /data/home/gerryyang/test/HACK/testlsof
testlsof 12371 gerryyang  mem    REG    8,1 1548470 1117263 /lib/libc-2.4.so
testlsof 12371 gerryyang  mem    REG    8,1  129040 1117255 /lib/ld-2.4.so
testlsof 12371 gerryyang  mem    REG    0,0               0 [stack] (stat: No such file or directory)
testlsof 12371 gerryyang    0u   CHR  136,0               2 /dev/pts/0
testlsof 12371 gerryyang    1u   CHR  136,0               2 /dev/pts/0
testlsof 12371 gerryyang    2u   CHR  136,0               2 /dev/pts/0
testlsof 12371 gerryyang    3r   REG    8,4       0 2359367 /data/home/gerryyang/test/HACK/wcdj
$ grep "wcdj" lsof.strace
readlink("/proc/12371/fd/3", "/data/home/gerryyang/test/HACK/wcdj", 4096) = 35
$ cd /proc/12371/fd
$ ls -l
总计 4
lrwx------ 1 gerryyang users 64 2012-03-23 14:14 0 -> /dev/pts/0
lrwx------ 1 gerryyang users 64 2012-03-23 14:14 1 -> /dev/pts/0
lrwx------ 1 gerryyang users 64 2012-03-23 14:14 2 -> /dev/pts/0
lr-x------ 1 gerryyang users 64 2012-03-23 14:14 3 -> /data/home/gerryyang/test/HACK/wcdj
用 strace 跟踪 lsof 的运行,输出结果保存在 lsof.strace 中。然后通过对 lsof.strace 内容的分析,从而了解到其实现原理是:lsof 利用了 /proc/pid/fd 目录。Linux 内核会为每一个进程在 /proc 建立一个以其 pid 为名的目录用来保存进程的相关信息,而其子目录 fd 保存的是该进程打开的所有文件的 fd。进入 /proc/pid/fd 目录下,发现每一个 fd 文件都是符号链接,而此链接就指向被该进程打开的一个文件。只要用 readlink() 系统调用就可以获取某个 fd 对应的文件了。
#include<stdio.h>
#include<string.h>
#include<sys/types.h>
#include<unistd.h>// readlink
#include<fcntl.h>
#include<sys/stat.h>

int get_pathname_from_fd(int fd, char pathname[], int n)
{
    char buf[1024];
    pid_t pid;
    bzero(buf, 1024);
    pid = getpid();
    snprintf(buf, 1024, "/proc/%i/fd/%i", pid, fd);// %i == %d

    return readlink(buf, pathname, n);
}

int main()
{
    int fd;
    char pathname[4096] = {0};
    bzero(pathname, 4096);
    fd = open("wcdj", O_RDONLY);

    get_pathname_from_fd(fd, pathname, 4096);

    printf("fd=%d; pathname=%s\n", fd, pathname);

    return 0;
}
/*
gcc -Wall -g -o GetPathByFd GetPathByFd.c
*/
ltrace
ltrace - A library call tracer
$ ltrace ./st1

__libc_start_main(0x8048494, 1, 0xbfe4a204, 0x8048500, 0x80484f0 <unfinished ...>
fopen("r", "r")                                                                                 = 0
puts("r"Error!
)                                                                                       = 7
sleep(3)                                                                                        = 0
fopen("r", "r")                                                                                 = 0
puts("r"Error!
)                                                                                       = 7
sleep(3 <unfinished ...>
--- SIGINT (Interrupt) ---
+++ killed by SIGINT +++
gdb
当发现进程异常时,比如CPU过高可以通过gdbattach到进程上查看具体情况,如果是多线程程序可以通过info threads选择异常的线程查看。
gdb -p `pidof program`

info threads
thread $id
gstack
gstack attaches to the active process named by the pid on the command line, and prints out an execution stack trace. If ELF symbols exist in the binary (usually the case unless you have run strip(1)), then symbolic addresses are printed as well.
$gstack 31310
Thread 2 (Thread 0x7f131c596700 (LWP 31315)):
#0  0x00007f13d2a6b1bd in nanosleep () from /lib64/libc.so.6
#1  0x00007f13d2a9bed4 in usleep () from /lib64/libc.so.6
...
#10 0x0000000000416cb0 in main (argc=<optimized out>, argv=<optimized out>) at base_server/base_so_loader.cc:216
gcore
gcore - Generate a core file of a running program.
gcore [-a] [-o prefix] pid1 [pid2...pidN]
Generate core dumps of one or more running programs with process IDs pid1, pid2, etc. A core file produced by gcore is equivalent to one produced by the kernel when the process crashes (and when “ulimit -c” was used to set up an appropriate core dump limit). However, unlike after a crash, after gcore finishes its job the program remains running without any change.
~$gcore 2302385
[New LWP 2302394]
[New LWP 2302403]
[New LWP 2302406]
[New LWP 2302412]
[New LWP 2302419]
[New LWP 2302457]
[New LWP 2302458]
[Thread debugging using libthread_db enabled]
Using host libthread_db library "/lib64/libthread_db.so.1".
0x00007ffb3f91f83d in nanosleep () from /lib64/libc.so.6
warning: target file /proc/2302385/cmdline contained unexpected null characters
Saved corefile core.2302385
[Inferior 1 (process 2302385) detached
disassemble
objdump -d /path/to/binary

gdb a.out
info functions
disassemble /m main
- https://stackoverflow.com/questions/5125896/how-to-disassemble-a-binary-executable-in-linux-to-get-the-assembly-code
backtrace
backtrace() returns a backtrace for the calling program, in the array pointed to by buffer.
参考:https://www.gnu.org/software/libc/manual/html_node/Backtraces.html
A backtrace is a list of the function calls that are currently active in a thread. The usual way to inspect a backtrace of a program is to use an external debugger such as gdb. However, sometimes it is useful to obtain a backtrace programmatically from within a program, e.g., for the purposes of logging or diagnostics.
The header file execinfo.h declares three functions that obtain and manipulate backtraces of the current thread.
int backtrace (void **buffer, int size)
The backtrace function obtains a backtrace for the current thread, as a list of pointers, and places the information into buffer. The argument size should be the number of void * elements that will fit into buffer. The return value is the actual number of entries of buffer that are obtained, and is at most size.
The pointers placed in buffer are actually return addresses obtained by inspecting the stack, one return address per stack frame.
Note that certain compiler optimizations may interfere with obtaining a valid backtrace. Function inlining causes the inlined function to not have a stack frame; tail call optimization replaces one stack frame with another; frame pointer elimination will stop backtrace from interpreting the stack contents correctly.
char ** backtrace_symbols (void *const *buffer, int size)
The backtrace_symbols function translates the information obtained from the backtrace function into an array of strings. The argument buffer should be a pointer to an array of addresses obtained via the backtrace function, and size is the number of entries in that array (the return value of backtrace).
The return value is a pointer to an array of strings, which has size entries just like the array buffer. Each string contains a printable representation of the corresponding element of buffer. It includes the function name (if this can be determined), an offset into the function, and the actual return address (in hexadecimal).
Currently, the function name and offset can only be obtained on systems that use the ELF binary format for programs and libraries. On other systems, only the hexadecimal return address will be present. Also, you may need to pass additional flags to the linker to make the function names available to the program. (For example, on systems using GNU ld, you must pass -rdynamic.)
The return value of backtrace_symbols is a pointer obtained via the malloc function, and it is the responsibility of the caller to free that pointer. Note that only the return value need be freed, not the individual strings.
The return value is NULL if sufficient memory for the strings cannot be obtained.
void backtrace_symbols_fd (void *const *buffer, int size, int fd)
The backtrace_symbols_fd function performs the same translation as the function backtrace_symbols function. Instead of returning the strings to the caller, it writes the strings to the file descriptor fd, one per line. It does not use the malloc function, and can therefore be used in situations where that function might fail.
The following program illustrates the use of these functions. Note that the array to contain the return addresses returned by backtrace is allocated on the stack. Therefore code like this can be used in situations where the memory handling via malloc does not work anymore (in which case the backtrace_symbols has to be replaced by a backtrace_symbols_fd call as well). The number of return addresses is normally not very large. Even complicated programs rather seldom have a nesting level of more than, say, 50 and with 200 possible entries probably all programs should be covered.
#include <execinfo.h>
#include <stdio.h>
#include <stdlib.h>

/* Obtain a backtrace and print it to stdout. */
void print_trace()
{
  void *array[10];
  char **strings;
  int size, i;

  size = backtrace(array, 10);
  strings = backtrace_symbols(array, size);
  if (strings != NULL)
  {
    printf("Obtained %d stack frames.\n", size);
    for (i = 0; i < size; i++)
      printf("%s\n", strings[i]);
  }

  free(strings);
}

/* A dummy function to make the backtrace more interesting. */
void dummy_function()
{
  print_trace();
}

int main()
{
  dummy_function();
  return 0;
}
测试代码:
#include <execinfo.h>
#include <stdio.h>
#include <stdlib.h>
#include <unistd.h>
#include <string.h>

#define BT_BUF_SIZE 100

void myfunc3()
{
    int nptrs;
    void *buffer[BT_BUF_SIZE];
    char **strings;

    nptrs = backtrace(buffer, BT_BUF_SIZE);
    printf("backtrace() returned %d addresses\n", nptrs);

    //--nptrs;
	//memmove(buffer, buffer + 1, sizeof(void*) * nptrs);

    for (int i = 0; i < nptrs; ++i) {
        printf("%s\n", buffer[i]);
    }

    /* The call backtrace_symbols_fd(buffer, nptrs, STDOUT_FILENO)
              would produce similar output to the following: */

    strings = backtrace_symbols(buffer, nptrs);
    if (strings == NULL) {
        perror("backtrace_symbols");
        exit(EXIT_FAILURE);
    }

    for (int j = 0; j < nptrs; ++j)
        printf("%s\n", strings[j]);

    free(strings);
}

/* "static" means don't export the symbol... */
static void myfunc2()
{
    myfunc3();
}

void myfunc(int ncalls)
{
    if (ncalls > 1)
        myfunc(ncalls - 1);
    else
        myfunc2();
}

int main(int argc, char *argv[])
{
    /*if (argc != 2) {
        fprintf(stderr, "%s num-calls\n", argv[0]);
        exit(EXIT_FAILURE);
    }

    myfunc(atoi(argv[1]));*/

    myfunc(3);
    exit(EXIT_SUCCESS);
}
/*
g++ backtrace.cc

$ ./a.out
backtrace() returned 8 addresses
./a.out(_Z7myfunc3v+0x2e) [0x5568d100da93]
./a.out(+0xb65) [0x5568d100db65]
./a.out(_Z6myfunci+0x25) [0x5568d100db8d]
./a.out(_Z6myfunci+0x1e) [0x5568d100db86]
./a.out(_Z6myfunci+0x1e) [0x5568d100db86]
./a.out(main+0x19) [0x5568d100dba9]
/lib/x86_64-linux-gnu/libc.so.6(__libc_start_main+0xe7) [0x7f57275c9bf7]
./a.out(_start+0x2a) [0x5568d100d9aa]
*/
使用GDB调试:
(gdb) p buffer[0]
$2 = (void *) 0x555555554873 <myfunc3()+46>
(gdb) p buffer[1]
$3 = (void *) 0x55555555497e <myfunc2()+9>
(gdb) p buffer[2]
$4 = (void *) 0x5555555549a6 <myfunc(int)+37>
(gdb) p buffer[3]
$5 = (void *) 0x55555555499f <myfunc(int)+30>
(gdb) p buffer[4]
$6 = (void *) 0x55555555499f <myfunc(int)+30>
(gdb) p buffer[5]
$7 = (void *) 0x5555555549c2 <main(int, char**)+25>
(gdb) p buffer[6]
$8 = (void *) 0x7ffff7a03bf7 <__libc_start_main+231>
(gdb) p buffer[7]
$9 = (void *) 0x55555555478a <_start+42>
(gdb) p buffer[8]
$10 = (void *) 0x0
优化方案:
assert
The definition of the macro assert depends on another macro, NDEBUG, which is not defined by the standard library.
- If
NDEBUGis defined as a macro name at the point in the source code where<cassert>is included, then assert does nothing. - If
NDEBUGis not defined, then assert checks if its argument (which must have scalar type) compares equal to zero. If it does, assert outputs implementation-specific diagnostic information on the standard error output and callsstd::abort. The diagnostic information is required to include the text of expression, as well as the values of the standard macros__FILE__,__LINE__, and the standard variable__func__(since C++11).
#include <iostream>
// uncomment to disable assert()
// #define NDEBUG
#include <cassert>

// Use (void) to silent unused warnings.
#define assertm(exp, msg) assert(((void)msg, exp))

int main()
{
    assert(2+2==4);
    std::cout << "Execution continues past the first assert\n";
    assertm(2+2==5, "There are five lights");
    std::cout << "Execution continues past the second assert\n";
    assert((2*2==4) && "Yet another way to add assert message");
}
/*
prog.exe: prog.cc:13: int main(): Assertion `((void)"There are five lights", 2+2==5)' failed.
Execution continues past the first assert
Aborted
*/
#include <stdio.h>
#include <exception>
#include <cassert>

int main()
{
    try
    {
        assert(0);
    }
    catch (std::exception &e)
    {
        printf("std::exception\n");
    }
    catch (...)
    {
        printf("...\n");
    }
}
/*
prog.exe: prog.cc:9: int main(): Assertion `0' failed.
Aborted
*/
- https://en.cppreference.com/w/cpp/error/assert
lsof
# 查看进程打开文件的情况
lsof -p pid
c++filt (Demangle C++ and Java symbols)
使用c++filt对符号进行 demangle 得到可读的符号名:
dlopen(./liballocatesvr_plugin.so) failed(./liballocatesvr_plugin.so: undefined symbol: _ZTIN6google8protobuf7MessageE)
$c++filt _ZTIN6google8protobuf7MessageE
typeinfo for google::protobuf::Message
addr2line (convert addresses into file names and line numbers)
addr2line translates addresses into file names and line numbers. Given an address in an executable or an offset in a section of a relocatable object, it uses the debugging information to figure out which file name and line number are associated with it.
安装方法:https://command-not-found.com/addr2line
# ubuntu
apt-get install binutils
https://linux.die.net/man/1/addr2line
$ addr2line -h
Usage: addr2line [option(s)] [addr(s)]
 Convert addresses into line number/file name pairs.
 If no addresses are specified on the command line, they will be read from stdin
 The options are:
  @<file>                Read options from <file>
  -a --addresses         Show addresses
  -b --target=<bfdname>  Set the binary file format
  -e --exe=<executable>  Set the input file name (default is a.out)
  -i --inlines           Unwind inlined functions
  -j --section=<name>    Read section-relative offsets instead of addresses
  -p --pretty-print      Make the output easier to read for humans
  -s --basenames         Strip directory names
  -f --functions         Show function names
  -C --demangle[=style]  Demangle function names
  -R --recurse-limit     Enable a limit on recursion whilst demangling.  [Default]
  -r --no-recurse-limit  Disable a limit on recursion whilst demangling
  -h --help              Display this information
  -v --version           Display the program's version

addr2line: supported targets: elf64-x86-64 elf32-i386 elf32-iamcu elf32-x86-64 pei-i386 pei-x86-64 elf64-l1om elf64-k1om elf64-little elf64-big elf32-little elf32-big pe-x86-64 pe-bigobj-x86-64 pe-i386 srec symbolsrec verilog tekhex binary ihex plugin
Report bugs to <http://bugzilla.redhat.com/bugzilla/>
测试代码:
// backtrace.c
#include <execinfo.h>
#include <stdio.h>
#include <stdlib.h>

/* Obtain a backtrace and print it to stdout. */
void
print_trace (void)
{
        void *array[10];
        size_t size;
        char **strings;
        size_t i;

        size = backtrace (array, 10);
        strings = backtrace_symbols (array, size);

        printf ("Obtained %zd stack frames.\n", size);

        for (i = 0; i < size; i++)
                printf ("%s\n", strings[i]);

        free (strings);
}

/* A dummy function to make the backtrace more interesting. */
void
dummy_function (void)
{
        print_trace ();
}

int
main (void)
{
        dummy_function ();
        return 0;
}
默认,符号全部导出,编译构建:
gcc -rdynamic backtrace.c
执行结果,可以显示堆栈的符号名称:
$./a.out
Obtained 5 stack frames.
./a.out(print_trace+0x19) [0x400896]
./a.out(dummy_function+0x9) [0x400918]
./a.out(main+0x9) [0x400923]
/lib64/libc.so.6(__libc_start_main+0xf5) [0x7f0e5326e555]
./a.out() [0x4007b9]
使用version-script控制不导出符号,symbol.txt配置为(即,只导出 foo* 开头的符号):
{
    global: foo*;
    local: *;
};
编译构建:
gcc -rdynamic backtrace.c -Wl,–version-script=symbol.txt
执行结果,只显示了地址信息,而没有符号信息:
$./a.out
Obtained 5 stack frames.
./a.out() [0x400676]
./a.out() [0x4006f8]
./a.out() [0x400703]
/lib64/libc.so.6(__libc_start_main+0xf5) [0x7fbec9745555]
./a.out() [0x400599]
使用 addr2line 对地址进行翻译:
$addr2line 0x400676 -f -e a.out
print_trace
:?
查看 elf 头部信息:
$readelf -h a.out
ELF 头:
  Magic:  7f 45 4c 46 02 01 01 00 00 00 00 00 00 00 00 00
  类别:                              ELF64
  数据:                              2 补码,小端序 (little endian)
  版本:                              1 (current)
  OS/ABI:                            UNIX - System V
  ABI 版本:                          0
  类型:                              EXEC (可执行文件)
  系统架构:                          Advanced Micro Devices X86-64
  版本:                              0x1
  入口点地址:              0x400570
  程序头起点:              64 (bytes into file)
  Start of section headers:          6776 (bytes into file)
  标志:             0x0
  本头的大小:       64 (字节)
  程序头大小:       56 (字节)
  Number of program headers:         9
  节头大小:         64 (字节)
  节头数量:         30
  字符串表索引节头: 29
注意,在 ubuntu 18.04 上测试上述程序,使用 addr2line 无法翻译地址信息。具体原因可参考:addr2line not woking on Ubuntu 16.10?
$ addr2line 0x55c43fa639fd -f -e a.out
??
??:0
elf 的头部信息显示:The entry point doesn’t start at 0x400000
$ readelf -h a.out
ELF Header:
  Magic:   7f 45 4c 46 02 01 01 00 00 00 00 00 00 00 00 00
  Class:                             ELF64
  Data:                              2's complement, little endian
  Version:                           1 (current)
  OS/ABI:                            UNIX - System V
  ABI Version:                       0
  Type:                              DYN (Shared object file)
  Machine:                           Advanced Micro Devices X86-64
  Version:                           0x1
  Entry point address:               0x8f0
  Start of program headers:          64 (bytes into file)
  Start of section headers:          6760 (bytes into file)
  Flags:                             0x0
  Size of this header:               64 (bytes)
  Size of program headers:           56 (bytes)
  Number of program headers:         9
  Size of section headers:           64 (bytes)
  Number of section headers:         29
  Section header string table index: 28
LD_DEBUG ./a.out
通过LD_DEBUG显示符号链接过程。
$ LD_DEBUG=all ./prog 2>&1 | grep cout
       919:     symbol=_ZSt5wcout;  lookup in file=./prog [0]
       919:     symbol=_ZSt5wcout;  lookup in file=/lib/x86_64-linux-gnu/libdl.so.2 [0]
       919:     symbol=_ZSt5wcout;  lookup in file=/usr/lib/x86_64-linux-gnu/libstdc++.so.6 [0]
       919:     binding file /usr/lib/x86_64-linux-gnu/libstdc++.so.6 [0] to /usr/lib/x86_64-linux-gnu/libstdc++.so.6 [0]: normal symbol `_ZSt5wcout' [GLIBCXX_3.4]
       919:     symbol=_ZSt4cout;  lookup in file=./prog [0]
       919:     binding file /usr/lib/x86_64-linux-gnu/libstdc++.so.6 [0] to ./prog [0]: normal symbol `_ZSt4cout' [GLIBCXX_3.4]
       919:     symbol=_ZSt4cout;  lookup in file=/lib/x86_64-linux-gnu/libdl.so.2 [0]
       919:     symbol=_ZSt4cout;  lookup in file=/usr/lib/x86_64-linux-gnu/libstdc++.so.6 [0]
       919:     binding file ./prog [0] to /usr/lib/x86_64-linux-gnu/libstdc++.so.6 [0]: normal symbol `_ZSt4cout' [GLIBCXX_3.4]
       919:     symbol=_ZSt4cout;  lookup in file=./libbar.so [0]
       919:     symbol=_ZSt4cout;  lookup in file=/lib/x86_64-linux-gnu/libc.so.6 [0]
       919:     symbol=_ZSt4cout;  lookup in file=/lib64/ld-linux-x86-64.so.2 [0]
       919:     symbol=_ZSt4cout;  lookup in file=./prog [0]
       919:     binding file ./libbar.so [0] to ./prog [0]: normal symbol `_ZSt4cout'
df -T (查看文件系统类型)
What is the maximum length of a file path in Ubuntu?
The max filename length is 255 bytes. Found in the wiki page for ext4.
And a maximum path of 4096 characters. Found in this Unix&Linux SE Question.
Although, I did find this wiki article that does not specify a max file path in ext4.
JLib$df -T
文件系统                        类型         1K-块      已用       可用 已用% 挂载点
overlay                         overlay 1048064000 517494544  530569456   50% /
tmpfs                           tmpfs        65536         0      65536    0% /dev
tmpfs                           tmpfs     65716364    495452   65220912    1% /run
/dev/vdi                        ext4     515928320 188255568  327656368   37% /data
9.134.56.11:/data1/share/tlinux nfs4    2105390080 423112704 1575306240   22% /tools
tmpfs                           tmpfs     65716364         0   65716364    0% /run/lock
tmpfs                           tmpfs     65716364     38924   65677440    1% /dev/shm
/dev/vdb                        xfs     1048064000 517494544  530569456   50% /etc/hosts
tmpfs                           tmpfs     65716364         0   65716364    0% /sys/fs/cgroup
tmpfs                           tmpfs     65716364         0   65716364    0% /proc/acpi
tmpfs                           tmpfs     65716364         0   65716364    0% /proc/scsi
tmpfs                           tmpfs     65716364         0   65716364    0% /sys/firmware
tmpfs                           tmpfs     13143276         0   13143276    0% /run/user/0
tmpfs                           tmpfs     13143276         0   13143276    0% /run/user/1012
jq (Command-line JSON processor)
jq is a lightweight and flexible command-line JSON processor.
https://stedolan.github.io/jq/
ethtool
ethtool - query or control network driver and hardware settings
$ethtool eth0
Settings for eth0:
        Supported ports: [ ]
        Supported link modes:   Not reported
        Supported pause frame use: No
        Supports auto-negotiation: No
        Supported FEC modes: Not reported
        Advertised link modes:  Not reported
        Advertised pause frame use: No
        Advertised auto-negotiation: No
        Advertised FEC modes: Not reported
        Speed: 10000Mb/s
        Duplex: Full
        Port: Twisted Pair
        PHYAD: 0
        Transceiver: internal
        Auto-negotiation: off
        MDI-X: Unknown
Cannot get wake-on-lan settings: Operation not permitted
        Link detected: yes
yum (CentOS)
查看安装包信息:
rpm -qa | grep redis
redis-3.2.10-2.el7.x86_64
查看安装包路径:
rpm -ql redis-3.2.10-2.el7.x86_64
scl
Setup and run software from Software Collection environment. See: https://linux.die.net/man/1/scl
scl <action> [<collection1> <collection2> ...] <command>
scl {-l|--list}
CentOS 安装 scl 相关工具
yum install tlinux-release-scl -y
yum install scl-utils -y
安装指定版本 gcc 工具,目前 scl 软件源中有 7/8/9 版本 devtoolset 安装的 gcc 中强制设置了 _GLIBCXX_USE_CXX11_ABI=0,如果需要采用 CXX11 ABI 为 1 的方式构建,需要手动修改对应的 c++config.h 配置
devtoolset-8的配置文件路径:/opt/rh/devtoolset-8/root/usr/include/c++/8/x86_64-redhat-linux/bits/c++config.h
devtoolset-9的配置文件路径:/opt/rh/devtoolset-9/root/usr/include/c++/9/x86_64-redhat-linux/bits/c++config.h
# define _GLIBCXX_USE_DUAL_ABI 1  // 将此值从0改为1

#if ! _GLIBCXX_USE_DUAL_ABI
// Ignore any pre-defined value of _GLIBCXX_USE_CXX11_ABI
# undef _GLIBCXX_USE_CXX11_ABI
#endif

#ifndef _GLIBCXX_USE_CXX11_ABI
# define _GLIBCXX_USE_CXX11_ABI 1  // 将此值从0改为1
#endif
在当前会话中打开新的会话窗口使用 gcc9 开发环境 scl enable devtoolset-9 /bin/bash
在编译脚本中执行时,在执行命令前通过 source scl_source enable devtoolset-9
eu-readelf
Usage: eu-readelf [OPTION...] FILE...
Print information from ELF file in human-readable form.
xxd
make a hexdump or do the reverse.
$xxd --help
Usage:
       xxd [options] [infile [outfile]]
    or
       xxd -r [-s [-]offset] [-c cols] [-ps] [infile [outfile]]
Options:
    -a          toggle autoskip: A single '*' replaces nul-lines. Default off.
    -b          binary digit dump (incompatible with -ps,-i,-r). Default hex.
    -c cols     format <cols> octets per line. Default 16 (-i: 12, -ps: 30).
    -E          show characters in EBCDIC. Default ASCII.
    -g          number of octets per group in normal output. Default 2.
    -h          print this summary.
    -i          output in C include file style.
    -l len      stop after <len> octets.
    -ps         output in postscript plain hexdump style.
    -r          reverse operation: convert (or patch) hexdump into binary.
    -r -s off   revert with <off> added to file positions found in hexdump.
    -s [+][-]seek  start at <seek> bytes abs. (or +: rel.) infile offset.
    -u          use upper case hex letters.
    -v          show version: "xxd V1.10 27oct98 by Juergen Weigert".
nfsiostat
nfsiostat 是一个用于监视 NFS(Network File System)I/O 性能的命令行工具。它可以显示 NFS 客户端和服务器上的 I/O 统计信息,包括读写操作的数量、传输速率和延迟等。
sudo yum install nfs-utils
显示 NFS 客户端上的 I/O 统计信息,包括读写操作的数量、传输速率和延迟等。
$nfsiostat

9.134.56.11:/data1/share/tlinux mounted on /tools:

   op/s         rpc bklog
   0.65    0.00
read:            ops/s             kB/s           kB/op         retrans         avg RTT (ms)    avg exe (ms)
                  0.000   0.000 318.509       0 (0.0%)    4.600   5.000
write:           ops/s             kB/s           kB/op         retrans         avg RTT (ms)    avg exe (ms)
                  0.000   0.000   0.000       0 (0.0%)    0.000   0.000
tcpdump
tcpdump - dump traffic on a network
使用 tcpdump 命令的前提:具有 root 权限。使用此命令需要注意的几个关键字:
- 类型的关键字。主要包括:host, net, port
- 确定传输方向的关键字。主要包括:src, dst, dst or src, dst and src
- 协议的关键字。主要包括:fddi, ip, arp, rarp, tcp, udp等,如果没有指定任何协议,则tcpdump会捕获所有协议的数据包
- 三种逻辑运算。包括:not, and, or
常用选项
-i     指定监听的网络接口,可以指定为: lo, any, eth0, eth1 等,(`-i lo` 表示只监控网卡 lo 设备,默认是监控第一个网络设备。)
-n     使用数字形式的 IP 名字,不使用域名
-s     指定抓包的长度,`-s0` 抓整个数据包
-X     以 hex 和 ASCII 的形式打印每一个包
-c     在抓到指定个数的包后退出
-w     直接将包写入文件中并不分析和打印出来(后续可以用 `tcpdump -r file` 进行分析)
-r     从指定的文件中读取抓包的信息(文件里的数据通过 `-w` 选项产生)
-e     在输出行打印出数据链路层的头部信息
-t     打印时每行不显示时间戳
-tt    打印时每行显示 UNIX 时间戳
-v     详细显示指令执行过程
-vv    更详细显示指令执行过程
常用的组合命令
(1) 捕获指定源地址和目的地址及端口
tcpdump -Xns0 -i eth1 src 172.27.198.179 and dst 10.130.73.95 and dst port 30007 -c10
(2) 捕获不区分源地址和目的地址
tcpdump -Xns0 -i eth1 host 172.27.198.179 and 10.130.73.95 and port 30007 -c10
(3) 只捕获本机指定端口的数据包
tcpdump -Xns0 -i eth1 port 30007
(4) 捕获所有172.27.198.179的主机收到的和发出的所有的数据包
tcpdump host 172.27.198.179
(5) 捕获(在任意网卡)指定地址和端口的数据包
tcpdump -i any -Xns0 host 172.27.198.179 and port 30007 -c 10
(6) 捕获主机172.27.198.179和主机172.27.198.169或10.130.73.95的数据包,注意在命令行中适用括号时,一定要转义
tcpdump host 172.27.198.179 and \ (172.27.198.169 or 10.130.73.95\) and port 30007 -c10
(7) 捕获主机172.27.198.179除了和主机10.130.73.95之外所有主机通信的IP数据包,注意!后面要有一个空格
tcpdump ip host 172.27.198.179 and ! 10.130.73.95
(8) 捕获主机172.27.198.179接收或发出的telnet数据包
tcpdump tcp port 23 and host 172.27.198.179
(9) 将捕获的数据包保存在文件中,进行后续分析
tcpdump -Xns0 host 172.27.198.179 -w 179.cap
tcpdump -r 179.cap
(10) 只显示具体的协议,不显示包体内容
# -S 打印 TCP 数据包的顺序号时,使用绝对的顺序号,而不是相对的顺序号
# -nn 表示不进行端口到名称的转换
# -vvv 表示产生尽可能详细的协议输出
# -i lo表示只监控网卡 lo 设备,默认是监控第一个网络设备
# port 6888 表示只监控端口 6888 的相关监控数据,包括从 6888 端口接收和从 6888 端口发送的报文

tcpdump -S -nn -vvv -i lo port 6888
(11) 将 tcpdump 的输出保存到文件,记录 3 分钟的数据
tcpdump -Xns0 -iany port 4318 -w output.pcap &
sleep 30

# $!是一个特殊的shell变量,表示最后一个后台进程的PID
kill $!
(12) 查看 output.pcap 的二进制内容
方法1: 使用 tcpdump 查看
# -r file
#    Read packets from file (which was created with the -w option or by other tools that write pcap or pcap-ng files).  Standard input is used if file is ``-''.
tcpdump -r output.pcap
方法2: 使用 Wireshark 查看
Wireshark 是一个功能强大的网络协议分析器,它可以图形化地展示数据包内容。
方法3: 使用 termshark 查看(命令行工具)
A terminal UI for tshark, inspired by Wireshark
https://github.com/gcla/termshark
# 安装依赖
yum install wireshark
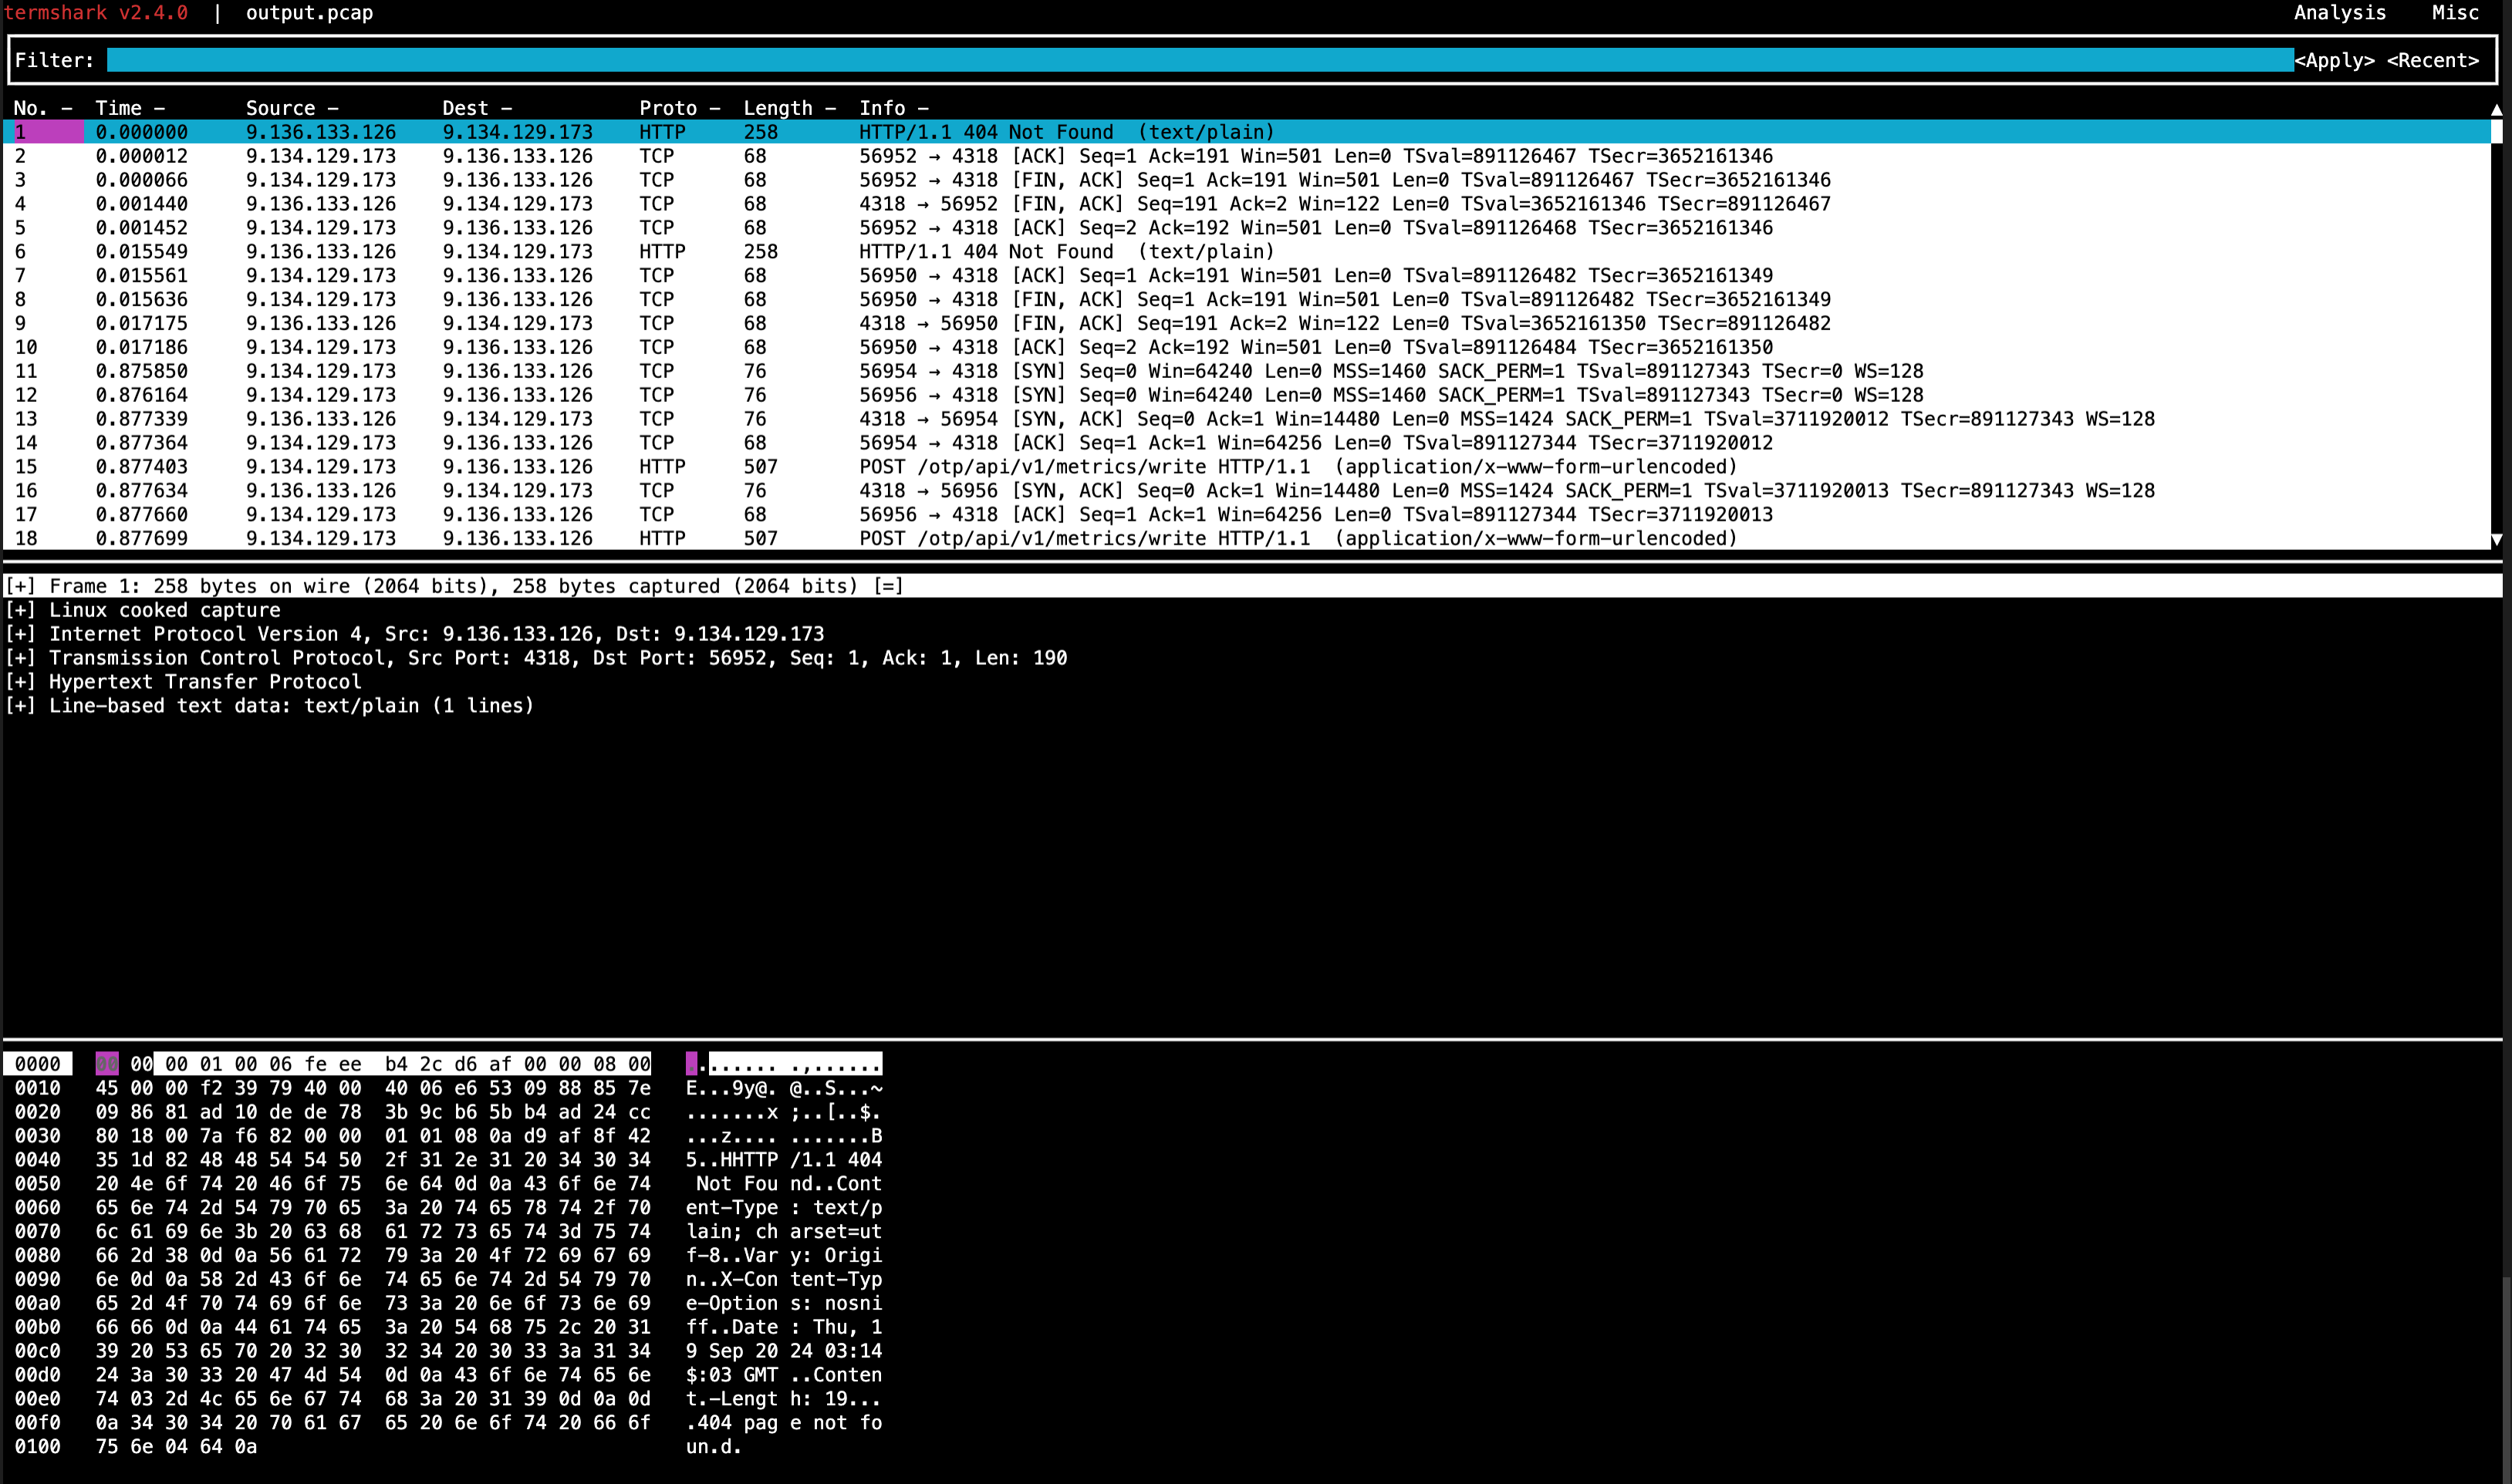
相关工具
tcpreplay:回放 tcpdump 的数据包,能够限速、修改发送地址等。tcprewrite:能够修改 tcpdump 的数据包中的源目的 mac 地址及 ip 地址等。
参考
- http://www.tcpdump.org/
- http://tcpreplay.synfin.net/
- 更多帮助 man tcpdump
netcat (nc)
在本地启动一个监听 TCP 端口 8080 的 netcat 服务,并将接收到的数据输出到终端
nc -l 8080
在本地计算机上启动一个监听 TCP 端口 8080 的 netcat 服务,并将接收到的数据保存到名为 received_data.txt 的文件
nc -l 8080 > received_data.txt
返回指定的应答内容
#!/bin/bash
nc -l 8080 < response.txt
HTTP/1.1 200 OK
Content-Type: text/plain
Content-Length: 29

{"rsp": {"switch_status": 2}}
连接到名为 remote.host.com 的远程主机上的 TCP 端口 8080,并向其发送字符串 "Hello, World!"
echo "Hello, World!" | nc remote.host.com 8080
将连接到名为 remote.host.com 的远程主机上的 TCP 端口 8080,并从名为 data_to_send.txt 的文件中读取数据并将其发送到远程主机
nc remote.host.com 8080 < data_to_send.txt
ldconfig
列出系统中已安装的所有动态库及其版本信息
ldconfig -p
rsync
原理
rsync works like this:
1. Build a file-list of the source location.

2. For all files in the source location:

  a. Get the size and the mtime (modification timestamp)
  b. Compare it with the size and mtime of the copy in the destination location
  c. If they differ, copy the file from the source to the destination

Done.
- https://stackoverflow.com/questions/38293783/why-is-rsync-so-slow
- https://docs.oracle.com/en-us/iaas/Content/File/Troubleshooting/rsync_is_slow_copying_files.htm
按文件层级拷贝文件
# 将 /a/b/file.txt 文件保持目录层级复制到 tmp 目录下
mkdir -p tmp
rsync -avz --relative ./a/b/file.txt tmp
-avz选项表示以归档模式拷贝文件,保留文件属性和权限--relative选项表示保持相对路径结构
可以根据文件的修改时间和内容来决定是否拷贝
存在这样的需求,在 linux 环境下,需要将一些文件拷贝到指定目录,如果指定目录已经存在这些文件且内容没有变化则不再拷贝,只有在内容或者文件时间发生改变时才允许拷贝,请用 bash 脚本实现这样的逻辑。
可以使用 rsync 命令来实现这个需求。rsync 是一个在本地和远程之间进行文件和目录同步的工具,可以根据文件的修改时间和内容来决定是否拷贝。
#!/bin/bash

# 源目录
src_dir="/path/to/source/"
# 目标目录
dst_dir="/path/to/destination/"

# 使用rsync命令进行同步
rsync -av --update "${src_dir}" "${dst_dir}"
在这个脚本中,使用了以下 rsync 选项:
-a:归档模式,保留文件属性(如时间戳、权限等)
-v:详细输出模式,显示同步过程中的文件信息
--update:仅在源文件较新或内容发生变化时才拷贝
将上述脚本保存为 sync_files.sh,然后通过 chmod +x sync_files.sh 赋予执行权限。执行脚本 ./sync_files.sh 即可实现所需功能。
注意:如果需要更严格的文件内容检查,需要使用 rsync 的 -c 或 –checksum 选项,但这会增加同步过程中的计算开销
bpftrace
bpftrace is a high-level tracing language for Linux enhanced Berkeley Packet Filter (eBPF) available in recent Linux kernels (4.x).
EXAMPLES
bpftrace -l '*sleep*'
        List probes containing "sleep".

bpftrace -e 'kprobe:do_nanosleep { printf("PID %d sleeping\n", pid); }'
        Trace processes calling sleep.

bpftrace -c 'sleep 5' -e 'kprobe:do_nanosleep { printf("PID %d sleeping\n", pid); }'
        run "sleep 5" in a new process and then trace processes calling sleep.

bpftrace -e 'tracepoint:raw_syscalls:sys_enter { @[comm]=count(); }'
        Count syscalls by process name.
FURTHER READING
The official documentation can be found here: https://github.com/iovisor/bpftrace/blob/master/docs
true
true - do nothing, successfully
$ which true
/bin/true
$ true
$ echo $?
0
command -v
在Linux下,command -v命令用于查找并显示给定命令的路径。它可以帮助你确定一个命令是否存在于系统中,以及该命令的可执行文件的位置。command -v命令与which命令类似,但command -v是POSIX标准的一部分,因此在不同的Unix-like系统(如Linux、macOS、BSD等)上可用性更高。
当使用command -v查询一个命令时,如果该命令存在于系统中,它会输出该命令的路径;如果命令不存在,它不会输出任何内容。
# Check if Bazelisk is already installed
if command -v bazel &> /dev/null; then
    echo "Bazelisk is already installed, version: $(bazel --version)"
else
    echo "Installing Bazelisk version ${BAZELISK_VERSION}..."
fi
使用LD_DEBUG环境变量查看某程序加载so的过程
# 查看帮助
LD_DEBUG=help ./bin

# display library search paths
LD_DEBUG=libs ./bin

# 将信息输出到log中
LD_DEBUG=libs LD_DEBUG_OUTPUT=log ./bin
errno
在 Linux 中可以通过 errno 命令来查看错误码对应的错误信息,在 centos 系统中可以通过下面方式安装。
yum install moreutils
$ errno 11
EAGAIN 11 Resource temporarily unavailable
$ errno -l
EPERM 1 Operation not permitted
ENOENT 2 No such file or directory
ESRCH 3 No such process
EINTR 4 Interrupted system call
EIO 5 Input/output error
ENXIO 6 No such device or address
E2BIG 7 Argument list too long
ENOEXEC 8 Exec format error
EBADF 9 Bad file descriptor
ECHILD 10 No child processes
EAGAIN 11 Resource temporarily unavailable
ENOMEM 12 Cannot allocate memory
EACCES 13 Permission denied
EFAULT 14 Bad address
ENOTBLK 15 Block device required
EBUSY 16 Device or resource busy
EEXIST 17 File exists
EXDEV 18 Invalid cross-device link
ENODEV 19 No such device
ENOTDIR 20 Not a directory
EISDIR 21 Is a directory
EINVAL 22 Invalid argument
ENFILE 23 Too many open files in system
EMFILE 24 Too many open files
ENOTTY 25 Inappropriate ioctl for device
ETXTBSY 26 Text file busy
EFBIG 27 File too large
ENOSPC 28 No space left on device
ESPIPE 29 Illegal seek
EROFS 30 Read-only file system
EMLINK 31 Too many links
EPIPE 32 Broken pipe
EDOM 33 Numerical argument out of domain
ERANGE 34 Numerical result out of range
EDEADLK 35 Resource deadlock avoided
ENAMETOOLONG 36 File name too long
ENOLCK 37 No locks available
ENOSYS 38 Function not implemented
ENOTEMPTY 39 Directory not empty
ELOOP 40 Too many levels of symbolic links
EWOULDBLOCK 11 Resource temporarily unavailable
ENOMSG 42 No message of desired type
EIDRM 43 Identifier removed
ECHRNG 44 Channel number out of range
EL2NSYNC 45 Level 2 not synchronized
EL3HLT 46 Level 3 halted
EL3RST 47 Level 3 reset
ELNRNG 48 Link number out of range
EUNATCH 49 Protocol driver not attached
ENOCSI 50 No CSI structure available
EL2HLT 51 Level 2 halted
EBADE 52 Invalid exchange
EBADR 53 Invalid request descriptor
EXFULL 54 Exchange full
ENOANO 55 No anode
EBADRQC 56 Invalid request code
EBADSLT 57 Invalid slot
EDEADLOCK 35 Resource deadlock avoided
EBFONT 59 Bad font file format
ENOSTR 60 Device not a stream
ENODATA 61 No data available
ETIME 62 Timer expired
ENOSR 63 Out of streams resources
ENONET 64 Machine is not on the network
ENOPKG 65 Package not installed
EREMOTE 66 Object is remote
ENOLINK 67 Link has been severed
EADV 68 Advertise error
ESRMNT 69 Srmount error
ECOMM 70 Communication error on send
EPROTO 71 Protocol error
EMULTIHOP 72 Multihop attempted
EDOTDOT 73 RFS specific error
EBADMSG 74 Bad message
EOVERFLOW 75 Value too large for defined data type
ENOTUNIQ 76 Name not unique on network
EBADFD 77 File descriptor in bad state
EREMCHG 78 Remote address changed
ELIBACC 79 Can not access a needed shared library
ELIBBAD 80 Accessing a corrupted shared library
ELIBSCN 81 .lib section in a.out corrupted
ELIBMAX 82 Attempting to link in too many shared libraries
ELIBEXEC 83 Cannot exec a shared library directly
EILSEQ 84 Invalid or incomplete multibyte or wide character
ERESTART 85 Interrupted system call should be restarted
ESTRPIPE 86 Streams pipe error
EUSERS 87 Too many users
ENOTSOCK 88 Socket operation on non-socket
EDESTADDRREQ 89 Destination address required
EMSGSIZE 90 Message too long
EPROTOTYPE 91 Protocol wrong type for socket
ENOPROTOOPT 92 Protocol not available
EPROTONOSUPPORT 93 Protocol not supported
ESOCKTNOSUPPORT 94 Socket type not supported
EOPNOTSUPP 95 Operation not supported
EPFNOSUPPORT 96 Protocol family not supported
EAFNOSUPPORT 97 Address family not supported by protocol
EADDRINUSE 98 Address already in use
EADDRNOTAVAIL 99 Cannot assign requested address
ENETDOWN 100 Network is down
ENETUNREACH 101 Network is unreachable
ENETRESET 102 Network dropped connection on reset
ECONNABORTED 103 Software caused connection abort
ECONNRESET 104 Connection reset by peer
ENOBUFS 105 No buffer space available
EISCONN 106 Transport endpoint is already connected
ENOTCONN 107 Transport endpoint is not connected
ESHUTDOWN 108 Cannot send after transport endpoint shutdown
ETOOMANYREFS 109 Too many references: cannot splice
ETIMEDOUT 110 Connection timed out
ECONNREFUSED 111 Connection refused
EHOSTDOWN 112 Host is down
EHOSTUNREACH 113 No route to host
EALREADY 114 Operation already in progress
EINPROGRESS 115 Operation now in progress
ESTALE 116 Stale file handle
EUCLEAN 117 Structure needs cleaning
ENOTNAM 118 Not a XENIX named type file
ENAVAIL 119 No XENIX semaphores available
EISNAM 120 Is a named type file
EREMOTEIO 121 Remote I/O error
EDQUOT 122 Disk quota exceeded
ENOMEDIUM 123 No medium found
EMEDIUMTYPE 124 Wrong medium type
ECANCELED 125 Operation canceled
ENOKEY 126 Required key not available
EKEYEXPIRED 127 Key has expired
EKEYREVOKED 128 Key has been revoked
EKEYREJECTED 129 Key was rejected by service
EOWNERDEAD 130 Owner died
ENOTRECOVERABLE 131 State not recoverable
ERFKILL 132 Operation not possible due to RF-kill
EHWPOISON 133 Memory page has hardware error
ENOTSUP 95 Operation not supported
C标准 定义了两个函数,用于打印出错信息:
char *strerror(int errnum);
void perror(const char *s);
strerror返回指向消息字符串的指针。strerror 函数将 errnum(通常就是 errno 值)映射为一个出错信息字符串,并且返回此字符串的指针。(可以用于自己的日志函数)perror函数基于 errno 的当前值,在标准出错上产生一条出错消息,然后返回。它首先输出由 s 指向的字符串(用户自己定义的信息),然后是一个冒号,一个空格,接着是对应于 errno 值的错误信息,最后是一个换行符(仅用于标准输出)
下面代码用于显示 errno 对应的错误信息:
#include <netinet/in.h>
#include <sys/types.h>
#include <sys/socket.h>
#include <errno.h>
#include <stdio.h>
#include <stdlib.h>
#include <time.h>

void fred(int error_number)
{
	fprintf(stderr, "%3d ", error_number);
	errno = error_number;
    perror("test");
}

int main()
{
	int socket1;
	int socket2;
	int the_error;

	struct timeval tv;
	for (the_error = 0; the_error <= 127; ++the_error)
	{
		fred(the_error);
	}

	fprintf(stderr, "==== about to find EDOM\n");
	fred(EDOM);
	fprintf(stderr, "==== about to do socket stuff\n");

	socket1 = socket(AF_INET, SOCK_STREAM, IPPROTO_TCP);
	if (socket1 < 0)
	{
		perror("first socket()");
		exit(1);
	}

	socket2 = socket(AF_INET, SOCK_STREAM, IPPROTO_TCP);
	if (socket2 < 0)
	{
		perror("second socket()");
		exit(1);
	}

	tv.tv_sec = 0;
	tv.tv_usec = 999999;

	if (setsockopt(socket1, SOL_SOCKET, SO_RCVTIMEO, &tv, sizeof(tv)) < 0)
	{
		perror("first setsockopt()");
	}
	else
	{
		fprintf(stderr, "first setsockopt() worked\n");
	}

	tv.tv_sec = 1;
	tv.tv_usec = 0;

	if(setsockopt(socket2, SOL_SOCKET, SO_RCVTIMEO, &tv, sizeof(tv)) < 0)
	{
		perror("second setsockopt()");
	}
	else
	{
		fprintf(stderr, "second setsockopt() worked\n");
	}

	return 0;
}
/*
0 test: Success
1 test: Operation not permitted
2 test: No such file or directory
3 test: No such process
4 test: Interrupted system call
...
127 test: Key has expired
==== about to find EDOM
 33 test: Numerical argument out of domain
==== about to do socket stuff
first setsockopt() worked
second setsockopt() worked
*/
nproc
# 显示当前进程可用的CPU数量
nproc

# 显示所有CPU数量
nproc --all
第三方工具
性能监控
GNU Parallel
GNU parallel is a shell tool for executing jobs in parallel using one or more computers. A job can be a single command or a small script that has to be run for each of the lines in the input. The typical input is a list of files, a list of hosts, a list of users, a list of URLs, or a list of tables. A job can also be a command that reads from a pipe. GNU parallel can then split the input and pipe it into commands in parallel.
If you use xargs and tee today you will find GNU parallel very easy to use as GNU parallel is written to have the same options as xargs. If you write loops in shell, you will find GNU parallel may be able to replace most of the loops and make them run faster by running several jobs in parallel.
GNU parallel makes sure output from the commands is the same output as you would get had you run the commands sequentially. This makes it possible to use output from GNU parallel as input for other programs.
For each line of input GNU parallel will execute command with the line as arguments. If no command is given, the line of input is executed. Several lines will be run in parallel. GNU parallel can often be used as a substitute for xargs or cat | bash.
用法示例
更多用法可参考:https://www.gnu.org/software/parallel/parallel_examples.html
Working as xargs -n1. Argument appending
GNU parallel can work similar to xargs -n1.
To compress all html files using gzip run:
find . -name '*.html' | parallel gzip --best
Reading arguments from command line
GNU parallel can take the arguments from command line instead of stdin (standard input). To compress all html files in the current dir using gzip run:
parallel gzip --best ::: *.html
Running full commands in parallel
If there is no command given to GNU parallel, then the arguments are treated as a command line.
To run gzip foo and bzip2 bar in parallel run:
parallel ::: "gzip foo" "bzip2 bar"
or:
(echo "gzip foo"; echo "bzip2 bar") | parallel
Inserting multiple arguments
When moving a lot of files like this: mv *.log destdir you will sometimes get the error:
bash: /bin/mv: Argument list too long
because there are too many files. You can instead do:
ls | grep -E '\.log$' | parallel mv {} destdir
This will run mv for each file. It can be done faster if mv gets as many arguments that will fit on the line:
ls | grep -E '\.log$' | parallel -m mv {} destdir
Composed commands
A job can consist of several commands. This will print the number of files in each directory:
# 查看当前目录的文件个数,不包括子目录
ls | parallel --no-notice 'echo -n {}" "; ls {}|wc -l'
# 查看当前目录的文件个数,包括子目录
ls | parallel --no-notice 'echo -n {}" "; find {} -type f |wc -l'
Function tester
To test a program with different parameters:
tester() {
  if (eval "$@") >&/dev/null; then
    perl -e 'printf "\033[30;102m[ OK ]\033[0m @ARGV\n"' "$@"
  else
    perl -e 'printf "\033[30;101m[FAIL]\033[0m @ARGV\n"' "$@"
  fi
}
export -f tester
parallel tester my_program ::: arg1 arg2
parallel tester exit ::: 1 0 2 0
If my_program fails a red FAIL will be printed followed by the failing command; otherwise a green OK will be printed followed by the command.
Log rotate
Log rotation renames a logfile to an extension with a higher number: log.1 becomes log.2, log.2 becomes log.3, and so on. The oldest log is removed. To avoid overwriting files the process starts backwards from the high number to the low number. This will keep 10 old versions of the log:
seq 9 -1 1 | parallel -j1 mv log.{} log.'{= $_++ =}'
mv log log.1
Simple network scanner
prips can generate IP-addresses from CIDR notation. With GNU parallel you can build a simple network scanner to see which addresses respond to ping:
prips 130.229.16.0/20 | \
  parallel --timeout 2 -j0 \
    'ping -c 1 {} >/dev/null && echo {}' 2>/dev/null
用法建议
Tips1: 使用 –no-notice 屏蔽 parallel 的版权提示信息
例如:
ls | parallel --no-notice 'echo -n {}" "; find {} -type f | wc -l'
Tips2: parallel命令有一个 –dry-run 选项,可以打印出实际执行的命令,而不是真正执行它们
可以将这个选项添加到命令中,来查看 parallel 命令实际执行的命令。
Tips3: –eta 参数用于显示估计的剩余时间
Computers / CPU cores / Max jobs to run
1:local / 48 / 48

Computer:jobs running/jobs completed/%of started jobs/Average seconds to complete
ETA: 0s Left: 3 AVG: 0.00s  local:3/411/100%/0.0s
以上信息输出的含义:
Computers / CPU cores / Max jobs to run:这一行提供了计算机的相关信息。在这个提示中,表示有 1 台计算机可用,拥有 48 个 CPU 核心,最大可同时运行 48 个作业。Computer:jobs running/jobs completed/%of started jobs/Average seconds to complete:这一行提供了每台计算机的作业状态和性能信息。ETA: 0s:ETA 是 Estimated Time of Arrival 的缩写,表示估计的剩余时间。在这个提示中,0s 表示估计的剩余时间为 0 秒,即任务预计即将完成。Left: 3:Left 表示剩余的任务数量。在这个提示中,3 表示还有 3 个任务需要完成。AVG: 0.00s:AVG 是 Average 的缩写,表示平均完成时间。在这个提示中,0.00s 表示平均每个任务的完成时间为 0 秒。local:3/411/100%/0.0s:local 表示当前计算机的状态。在这个提示中,3 表示当前计算机正在运行 3 个任务,411 表示已经完成了 411 个任务,100% 表示已经启动的任务的百分比,0.0s 表示平均每个任务的完成时间为 0 秒。
atop
atop 工具是一种性能监控工具,可记录历史资源使用情况以供以后分析。该工具还可以进行实时报告。可以检索每个进程和线程的 CPU 利用率、内存消耗和磁盘 I/O 的使用情况。atop 工具作为后台负保持活动状态,同时记录统计信息,以便进行长期的服务器分析。默认情况下,统计信息将存储 28 天。
注意: atop 仅在安装后才开始记录数据。在 atop 安装日期之前,无法检索有关过程的历史性能数据。
atop 工具在 /var/log/atop 中创建日志文件。这些文件以下列格式命名:atop_ccyymmdd。例如,atop_20210902 是 2021 年 9 月 2 日的记录。
要访问日志文件,请运行命令 atop -r atoplogfilepath。将 atoplogfilepath 替换为 atop 日志文件的完整路径。命令和日志文件如以下示例所示:
atop -r /var/log/atop/atop_20210902

ATOP - ip-172-20-139-91                2021/09/02  17:03:44                ----------------                 3h33m7s elapsed
PRC |  sys    6.51s  |  user   7.85s  |  #proc    103  |  #tslpi    81 |  #tslpu     0  |  #zombie    0  |  #exit      0  |
CPU |  sys     0%  |  user      3%  |  irq       0%  |  idle    197% |  wait      0%  |  ipc notavail  |  curscal   ?%  |
cpu |  sys     0%  |  user      1%  |  irq       0%  |  idle     98% |  cpu000 w  0%  |  ipc notavail  |  curscal   ?%  |
cpu |  sys     0%  |  user      1%  |  irq       0%  |  idle     98% |  cpu001 w  0%  |  ipc notavail  |  curscal   ?%  |
在前面的输出示例中,第一个记录的快照是在 2021/09/02 17:03:44。要前进到下一个快照,请按键盘上的 t 键(小写)。要返回到上一个快照,请按 T 键(大写)。
要分析特定时隙,请按 b 键,然后输入日期和时间。atop 工具会跳到输入新时间变量中指定的时间:
NET |  lo      ----  |  pcki       2  |  pcko       2  |  sp    0 Mbps |  si    0 Kbps  |  so    0 Kbps  |  erro       0  |
Enter new time (format [YYYYMMDD]hhmm):
  PID              TID              RDDSK              WRDSK             WCANCL              DSK             CMD        1/4
可以按快捷键查看不同的统计数据:
| 快捷键 | 说明 |
|---|---|
| g | 通用信息(原定设置值) |
| m | 内存详细信息 |
| d | 磁盘详细信息 |
| n | 网络详细信息。只有在安装了 netatop 内核模块时,此密钥才有效 |
| c | 每个进程的完整命令行 |
可以使用以下快捷键对进程列表进行排序:
| 快捷键 | 排序依据 |
|---|---|
| C | CPU 活动 |
| M | 内存消耗量 |
| D | 磁盘活动 |
| N | 网络活动。只有在安装了 netatop 内核时,此密钥才有效 |
| A | 最活跃的系统资源(自动模式) |
按 h 键查看帮助文档。
yum install atop
Usage: atop [-flags] [interval [samples]]
                or
Usage: atop -w  file  [-S] [-a] [interval [samples]]
       atop -r [file] [-b [YYYYMMDD]hhmm] [-e [YYYYMMDD]hhmm] [-flags]

        generic flags:
          -V  show version information
          -a  show or log all processes (i.s.o. active processes only)
          -R  calculate proportional set size (PSS) per process
          -W  determine WCHAN (string) per thread
          -P  generate parseable output for specified label(s)
          -Z  no spaces in parseable output for command (line)
          -L  alternate line length (default 80) in case of non-screen output
          -f  show fixed number of lines with system statistics
          -F  suppress sorting of system resources
          -G  suppress exited processes in output
          -l  show limited number of lines for certain resources
          -y  show threads within process
          -Y  sort threads (when combined with 'y')
          -1  show average-per-second i.s.o. total values

          -x  no colors in case of high occupation
          -g  show general process-info (default)
          -m  show memory-related process-info
          -d  show disk-related process-info
          -n  show network-related process-info
          -s  show scheduling-related process-info
          -v  show various process-info (ppid, user/group, date/time)
          -c  show command line per process
          -o  show own defined process-info
          -u  show cumulated process-info per user
          -p  show cumulated process-info per program (i.e. same name)
          -j  show cumulated process-info per container

          -C  sort processes in order of cpu consumption (default)
          -M  sort processes in order of memory consumption
          -D  sort processes in order of disk activity
          -N  sort processes in order of network activity
          -E  sort processes in order of GPU activity
          -A  sort processes in order of most active resource (auto mode)

        specific flags for raw logfiles:
          -w  write raw data to   file (compressed)
          -r  read  raw data from file (compressed)
              symbolic file: y[y...] for yesterday (repeated)
              file name '-': read raw data from stdin
          -S  finish atop automatically before midnight (i.s.o. #samples)
          -b  begin showing data from specified date/time
          -e  finish showing data after specified date/time

        interval: number of seconds   (minimum 0)
        samples:  number of intervals (minimum 1)

If the interval-value is zero, a new sample can be
forced manually by sending signal USR1 (kill -USR1 pid_atop)
or with the keystroke 't' in interactive mode.

Please refer to the man-page of 'atop' for more details.
- 创建 atop 日志存储目录
mkdir ~/atop_data
- 以下是 atop 的默认配置,可以调整 atop 监控周期,默认 600s 采集一次
$ cat /etc/sysconfig/atop
LOGOPTS=""
LOGINTERVAL=600
LOGGENERATIONS=28
LOGPATH=/var/log/atop
- 使能和重启 atop
systemctl enable atop.serivce
systemctl restart atop.service
- 查看日志方法
atop -r atop_20230827
- 如何防止 atop.acct 文件过大
方法1: 调整 atop 配置。如果可能,可以调整 atop 的配置,减少采样频率或者采样的信息量,以减少进程记账文件的大小。 方法2: 监控文件大小。可以创建一个简单的脚本,定期检查 atop.acct 文件的大小。如果文件大小超过预设的阈值,可以清空文件。例如:实现下面的脚本 check_atop_acct.sh,并通过 cron 定时执行此脚本。
#!/bin/bash
FILE="/var/cache/atop.d/atop.acct"
MAX_SIZE=$((200 * 1024 * 1024)) # 设定最大文件大小为 200 MiB

file_size=$(stat -c%s "$FILE")

if ((file_size > MAX_SIZE)); then
    echo "atop.acct 文件过大,清空文件"
    echo -n > "$FILE"
fi
refer:
- https://manpages.debian.org/testing/atop/atop.1.en.html
- 如何使用 atop 工具获取 EC2 Linux 实例上进程的历史利用率统计信息?
atopsar
atopsar 命令的功能类似于传统的 UNIX sar 命令。您可以使用 atopsar 命令生成各种系统活动报告。
atopsar 命令使用颜色编码和(根据要求)标记来突出显示资源的利用率。关键利用率用红色标记,几乎关键用青色标记。
在以下示例中,使用标志 -c 生成有关系统当前 CPU 利用率的报告。以下示例显示了两个结果,相隔一秒钟。
$ atopsar -c 1 2

ip-172-20-139-91  4.14.238-182.422.amzn2.x86_64  #1 SMP Tue Jul 20 20:35:54 UTC 2021  x86_64  2021/09/02

-------------------------- analysis date: 2021/09/02 --------------------------

18:50:16  cpu  %usr %nice %sys %irq %softirq  %steal %guest  %wait %idle  _cpu_
18:50:17  all     0     0    0    0        0       0      0      0   200
            0     0     0    0    0        0       0      0      0   100
            1     0     0    0    0        0       0      0      0   100
18:50:18  all     0     0    0    0        0       0      0      0   200
            0     0     0    0    0        0       0      0      0   100
            1     0     0    0    0        0       0      0      0   100
压缩工具
zlib
zlib is designed to be a free, general-purpose, legally unencumbered – that is, not covered by any patents – lossless data-compression library for use on virtually any computer hardware and operating system.
zstd
Zstandard, or zstd as short version, is a fast lossless compression algorithm, targeting real-time compression scenarios at zlib-level and better compression ratios. It’s backed by a very fast entropy stage, provided by Huff0 and FSE library.
$./zstd -h
Compress or decompress the INPUT file(s); reads from STDIN if INPUT is `-` or not provided.

Usage: zstd [OPTIONS...] [INPUT... | -] [-o OUTPUT]

Options:
  -o OUTPUT                     Write output to a single file, OUTPUT.
  -k, --keep                    Preserve INPUT file(s). [Default]
  --rm                          Remove INPUT file(s) after successful (de)compression.

  -#                            Desired compression level, where `#` is a number between 1 and 19;
                                lower numbers provide faster compression, higher numbers yield
                                better compression ratios. [Default: 3]

  -d, --decompress              Perform decompression.
  -D DICT                       Use DICT as the dictionary for compression or decompression.

  -f, --force                   Disable input and output checks. Allows overwriting existing files,
                                receiving input from the console, printing output to STDOUT, and
                                operating on links, block devices, etc. Unrecognized formats will be
                                passed-through through as-is.

  -h                            Display short usage and exit.
  -H, --help                    Display full help and exit.
  -V, --version                 Display the program version and exit.
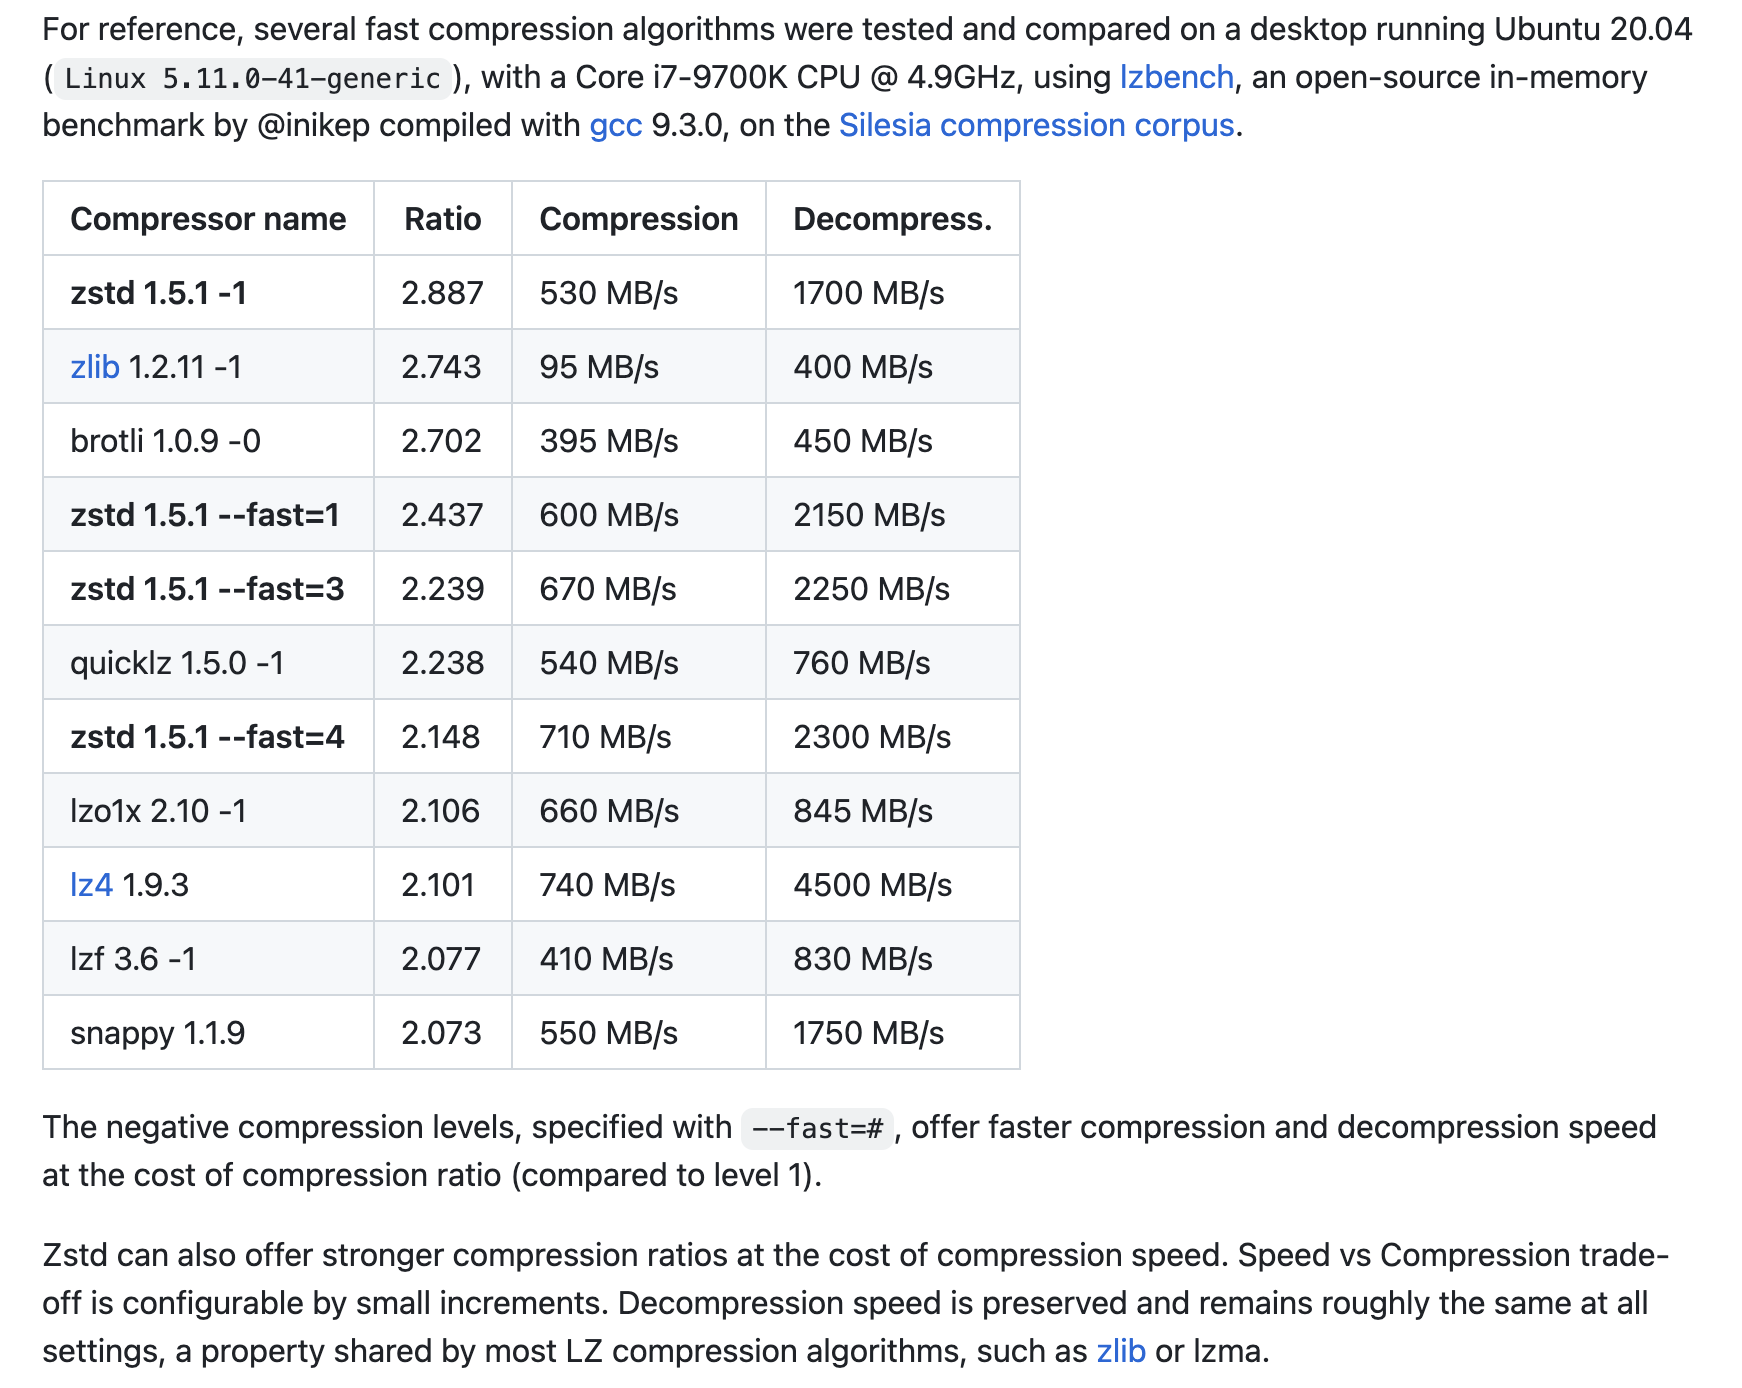
gunzip
.gz is a gzipped file and is not related to tar. To unzip a gzipped file you use the gunzip command.
gunzip filename.vw.gz
https://stackoverflow.com/questions/50625441/how-to-unzip-a-vw-gz-file-in-linux
cloc - Count Lines of Code
cloc --show-lang显示支持的语言cloc ./ --exclude-dir=node_modules排除某个目录分析cloc --quiet -by-file ./ --exclude-dir=node_modules --include-lang=Go | grep ".go" | sort -rn -k 4 | head -n 10统计代码行数(排除注释)排名前10的go文件
首先 –quiet 是把输出结果精简化了,一些总计的结果给过滤了。然后使用 -by-file 代表统计的时候按照文件统计,而不是按照默认的语言统计, –exclude-dir 表示省略 node_modules 文件夹。 –include-lang 这里直接标记将 Golang 的文件统计出来。上面这些 cloc 的命令就把 ./ 下有哪些 go 文件,每个文件的空格多少行,注释多少行,真正代码多少行都列出来了。然后使用 grep “.go” 把一些噪音输出过滤掉,只留下“文件名\t空格行数\t注释行数\t代码行数”,后面的 sort -rn -k 4 按照第四列(代码行数)倒序排列,并且 head -n 10 显示前10个文件。
diskusage
A tool for showing disk usage. (Linux, MacOS and Windows)
https://github.com/chenquan/diskusage
$diskusage .
Total: 4.514M   /data/home/gerryyang/tools/diskusage
-------------------------------------------------------------
 4.5M  99.9% ┌─ diskusage
 2.7K   0.1% └─ README.md
域名解析
Dnsmasq
The DNS subsystem provides a local DNS server for the network, with forwarding of all query types to upstream recursive DNS servers and caching of common record types (A, AAAA, CNAME and PTR, also DNSKEY and DS when DNSSEC is enabled).
/etc/nsswitch.conf
/etc/nsswitch.conf 文件是一个文本配置文件,主要用于控制在 Linux 和类 Unix 系统上进行各种名称服务查找时如何处理不同的数据库。换句话说,它定义了操作系统应该按照什么顺序或源(例如:文件、DNS、LDAP 或其他目录服务)查找主机名、用户、组等信息。
/etc/nsswitch.conf 中的配置与请求的信息类型相关。这包括主机名解析(主机)、用户和组名称解析(passwd 和 group)和其他数据库,如服务、网络和 RPC。
文件格式:
/etc/nsswitch.conf 文件以关键字和与其关联的多个服务条目组成。每行开始一个关键字,后跟一个冒号,随后是以空格分隔的一系列服务,按优先级顺序排列。
用法示例:
passwd:         compat
group:          compat
shadow:         compat

hosts:          files dns
networks:       files

protocols:      db files
services:       db files
ethers:         db files
rpc:            db files

netgroup:       nis
passwd: compat、group: compat和shadow: compat字段定义了在解析用户、组和阴影密码方面使用/etc/passwd、/etc/group和/etc/shadow文件中的兼容信息。hosts: files dns表示在解析主机名时,首先查看/etc/hosts文件,然后再查询 DNS 服务器。networks: files表示在查找网络名称时,只查询/etc/networks文件。protocols: db files、services: db files等字段表示从相应的 /etc 目录中的数据库文件中查找信息。
备注:
- 修改
/etc/nsswitch.conf文件后,更改会立即生效,无需重新启动任何服务。 - 请谨慎修改
/etc/nsswitch.conf文件,因为错误的设置可能导致系统无法正常解析主机名、用户或组。始终确保在进行更改之前创建备份。
/etc/resolv.conf
/etc/resolv.conf 是一个文本配置文件,主要用于配置在 Linux 和类 Unix 系统上进行域名解析时使用的 DNS 服务器。该文件受到 GNU C Library 的 libc 解析器(getaddrinfo() 和 gethostbyname() 等函数)和其他低级DNS解析库的支持。
文件格式:
/etc/resolv.conf 文件由一系列简单的关键字-值对行组成,每行关键字后面跟一个或多个值,值之间以空格分隔。
用法示例:
nameserver 8.8.8.8
nameserver 8.8.4.4
search example.com example.org
options timeout:2 attempts:3
- 第一行和第二行定义了两个 DNS 服务器。它们分别使用了 Google 公共 DNS 服务器的 IP 地址 8.8.8.8 和 8.8.4.4。解析器将首先查询第一个服务器,在查询失败的情况下尝试第二个服务器。
- 第三行表示非 FQDN 查询时,系统将按顺序尝试在 example.com 和 example.org 两个域中查找。
- 第四行为高级选项,定义了查询超时时间为 2 秒,并将尝试最多 3 次。
备注:
- 修改 /etc/resolv.conf 文件后,更改会立即生效,无需重新启动任何服务。
- 许多现代 Linux 发行版使用 DHCP 客户端、网络管理器或其他网络服务自动管理 /etc/resolv.conf 文件,并可以生成动态版本。要将用户自定义设置添加到由这些服务自动更新的 /etc/resolv.conf 文件,请查阅特定服务的文档。
/etc/hosts
/etc/hosts 文件是一个简单的文本文件,主要用于在没有 DNS 服务器的情况下解析主机名到 IP 地址。当 Linux 系统中的一个程序在进行主机名到 IP 地址的解析时,Linux 将首先检查 /etc/hosts 文件中是否存在与该主机名匹配的条目,之后才会查询 DNS 服务器。这意味着 /etc/hosts 文件中的定义具有优先权,可以用于覆盖 DNS 中的记录。
文件格式:
/etc/hosts 文件的格式很简单,每行定义一个主机名到 IP 地址的映射。每行至少包含一个 IP 地址和一个主机名,它们之间用空格或制表符分隔。您还可以在同一行中提供多个主机名(绰号)以在查找某个 IP 地址时使用,每个主机名之间用空格或制表符分隔。
用法示例:
127.0.0.1   localhost
192.168.1.1 myserver.example.com myserver
- 第一行将 IP 地址 127.0.0.1 映射到主机名 localhost,它表示当前设备。
- 第二行将 IP 地址 192.168.1.1 映射到主机名 myserver.example.com 和 myserver。在这种情况下,myserver.example.com 是完全限定域名(FQDN),而 myserver 是一个简称,可以在解析这个 IP 地址时使用。
备注:
- 要修改 /etc/hosts 文件,您需要使用 root(管理员)权限。
- 修改 /etc/hosts 文件后,更改会立即生效,无需重新启动任何服务。
List of Unix commands
This is a list of Unix commands as specified by IEEE Std 1003.1-2008, which is part of the Single UNIX Specification (SUS). These commands can be found on Unix operating systems and most Unix-like operating systems.
This is not a comprehensive list of all utilities that existed in the various historic Unix and Unix-like systems, as it excludes utilities that were not mandated by the aforementioned standard.
| Name | Description |
|---|---|
| alias | Define or display aliases |
ls 根据文件大小倒序排序
ls -lSh
ls 命令用于列出目录内容。 -l 选项表示以长格式输出文件信息。 -S 选项表示按文件大小排序。 -h 选项表示以人类可读的格式显示文件大小(例如,1K、234M、2G 等)。
这个命令会按照文件大小倒序输出当前目录的文件信息。
Q&A
业务进程 crash 在 SIGTRAP 信号
Any time, that’s how signals work. Normally SIGTRAP is a debugging signal - trace/breakpoint. So likely someone tried to attach a process debugger to it.
As said in the comments, it is a signal so can be triggered at any time. SIGTRAP signal is handled by the debugger; in the absence of a debugger it is quite natural for the process to be terminated. If you are using static libraries in your project then you are not linking them appropriately. Without further information in your question, I suggest you to check your linking with libraries. (Does getting random SIGTRAP signals (in MinGW-gdb) is a sign of memory corruption?)
With processors that support instruction breakpoints or data watchpoints, the debugger will ask the CPU to watch for instruction accesses to a specific address, or data reads/writes to a specific address, and then run full-speed.
When the processor detects the event, it will trap into the kernel, and the kernel will send SIGTRAP to the process being debugged. Normally, SIGTRAP would kill the process, but because it is being debugged, the debugger will be notified of the signal and handle it, mostly by letting you inspect the state of the process before continuing execution.
With processors that don’t support breakpoints or watchpoints, the entire debugging environment is probably done through code interpretation and memory emulation, which is immensely slower. (I imagine clever tricks could be done by setting pagetable flags to forbid reading or writing, whichever needs to be trapped, and letting the kernel fix up the pagetables, signaling the debugger, and then restricting the page flags again. This could probably support near-arbitrary number of watchpoints and breakpoints, and run only marginally slower for cases when the watchpoint or breakpoint aren’t frequently accessed.)
The question I placed into the comment field looks apropos(恰好,适当的) here, only because Windows isn’t actually sending a SIGTRAP, but rather signaling a breakpoint in its own native way. I assume when you’re debugging programs, that debug versions of system libraries are used, and ensure that memory accesses appear to make sense. You might have a bug in your program that is papered-over at runtime, but may in fact be causing further problems elsewhere.
I haven’t done development on Windows, but perhaps you could get further details by looking through your Windows Event Log?
I received a SIGTRAP from my debugger and found out that the cause was due to a missing return value.
string getName() { printf("Name!");};
My app is randomly (once a day) crashed and I have tried several ways to find out the reason but no luck. With other core dump or segmentation fault cases, I can locate where does it happen by gdb, but for this case, gdb don’t give me too much hint. I need some advice for my continuous debugging, please help.
GDB output when my app crashed
[Thread debugging using libthread_db enabled]
    Using host libthread_db library "/lib/x86_64-linux-gnu/libthread_db.so.1".
    Core was generated by `/home/greystone/myapp/myapp'.
    Program terminated with signal SIGTRAP, Trace/breakpoint trap.
    #0  0x00007f5d3a435afb in g_logv () from /lib/x86_64-linux-gnu/libglib-2.0.so.0
    [Current thread is 1 (Thread 0x7f5cea3d4700 (LWP 14353))]
    (gdb) bt full
    #0  0x00007f5d3a435afb in g_logv () from /lib/x86_64-linux-gnu/libglib-2.0.so.0
    No symbol table info available.
    #1  0x00007f5d3a435c6f in g_log () from /lib/x86_64-linux-gnu/libglib-2.0.so.0
    No symbol table info available.
    #2  0x00007f5d3a472742 in ?? () from /lib/x86_64-linux-gnu/libglib-2.0.so.0
    No symbol table info available.
    #3  0x00007f5d3a42cab3 in g_main_context_new () from /lib/x86_64-linux-gnu/libglib-2.0.so.0
    No symbol table info available.
    #4  0x00007f5d3f4894c9 in QEventDispatcherGlibPrivate::QEventDispatcherGlibPrivate(_GMainContext*) () from /opt/Qt5.9.2/5.9.2/gcc_64/lib/libQt5Core.so.5
Solutions I have tried
- Search topic related with SIGTRAP
- People said it is in debug mode and there are somewhere in the code set break point. However, my app is compiled in release mode without break point.
- Catch signal handler and ignore
SIGTRAP(补充说明:经测试,在程序中忽略 SIGTRAP 信号后,是不会出现 crash 的)- No success, I can only ignore SIGTRAP sent by “kill -5 pid”. With the SIGTRAP occurs randomly in runtime, my app is still crashed
- Fix memory leak in code
- Initialize pointer with nullptr
- Double check mysql C API race conditions
- Double check delete array action and double check assign value for the index out of array boundaries
- Check signals and slots
- My app is built on Qt frameworks as a GUI application, there are many signals and slots I have checked but no ideas how are they related to
SIGTRAPcore dump.
- My app is built on Qt frameworks as a GUI application, there are many signals and slots I have checked but no ideas how are they related to
- Check exceptions for opencv
- I use opencv for image processing tasks. I have checked for exception cases
- Shared memory
- Memory shared between main process and sub processes were carefully checked
GDB tells you exactly what happened, you just didn’t understand it.
What’s happening is that some code in libglib called g_logv(..., G_LOG_FLAG_FATAL, ...), which eventually calls _g_log_abort(), which executes int3 (debug breakpoint) instruction.
You should be able to (gdb) x/i 0x00007f5d3a435afb and see that instruction.
It looks like g_main_context_new() may have failed to allocate memory.
In any case, you should look in the application stderr logs for the reason libglib is terminating your program (effectively, libglib calls an equivalent of abort, because some precondition has failed).
-
Trapflag-Tracing I: Observing the Execution of a Program from Within Itself
-
https://man7.org/linux/man-pages/man2/ptrace.2.html