CPP Best Practices
- Prepare
- Conventions
- Modern C++
- Format
- Compiler
- Build
- Test
- Check
- Debug
- Tools
- Manual
- Posts
- Common Libraries
- glibc
- GCC (the GNU Compiler Collection)
- LLVM
- Refer
Prepare
查看当前环境 C++ 版本:
$ ls -l /lib64/libstdc++.so.6
lrwxrwxrwx 1 root root 19 Aug 18  2020 /lib64/libstdc++.so.6 -> libstdc++.so.6.0.25
$ rpm -qf /lib64/libstdc++.so.6
libstdc++-8.3.1-5.el8.0.2.x86_64
Conventions
- CPP Style Guide
-
Use the Pitchfork project layout conventions.
- Consider enforcing a coding convention:
Coding conventions are a set of guidelines for a specific programming language that recommend programming style, practices, and methods for each aspect of a program written in that language. These conventions usually cover file organization, indentation, comments, declarations, statements, white space, naming conventions, programming practices, programming principles, programming rules of thumb, architectural best practices, etc. These are guidelines for software structural quality. Software programmers are highly recommended to follow these guidelines to help improve the readability of their source code and make software maintenance easier. Coding conventions are only applicable to the human maintainers and peer reviewers of a software project. Conventions may be formalized in a documented set of rules that an entire team or company follows, or may be as informal as the habitual coding practices of an individual. Coding conventions are not enforced by compilers.
Modern C++
- https://github.com/rigtorp/awesome-modern-cpp
- A Tour of C++ (Bjarne Stroustrup) [C++11/17/20]
- The C++ Programming Language (Bjarne Stroustrup) [C++11]
- 21st Century C++ - Presenting the key contemporary C++ mechanism designed to maintain compatibility over decades. By Bjarne Stroustrup, Posted Feb 4 2025
- Effective Modern C++ - (Scott Meyers) [C++11/14]
- C++17 - The Complete Guide (Nicolai M. Josuttis) [C++17] - Giving guidance on how to use Language and Library Features of C++17.
-
Modern C++ Tutorial: C++ 11/14/17/20 On the Fly (Changkun Ou) - The book claims to be “On the Fly”. Its intent is to provide a comprehensive introduction to the relevant features regarding modern C++ (before 2020s).
- Modern CPP in Action
Format
- Never manually format code, use clang-format to format your code.
- CPP ClangFormat in Action
Compiler
- 编译器对 C++ 标准的支持情况:https://en.cppreference.com/w/cpp/compiler_support
- GCC in Action
- Clang in Action
Build
- Build your code using CMake.
- CMake in Action
- Modern CMake in Action
- Bazel in Action
- Make in Action
-
Professional CMake (Craig Scott) - A practical guide for using CMake to build your C++ projects.
- Enable at least
-Wall -Wextra -Wpedanticwarning options (GCC, clang).
-Wpedantic
Issue all the warnings demanded by strict ISO C and ISO C++; diagnose all programs that use forbidden extensions, and some other programs that do not follow ISO C and ISO C++. This follows the version of the ISO C or C++ standard specified by any
-stdoption used.
- Use compiler options to harden your application from security exploits:
Test
- Unit Testing Framework
- Write unit tests using Catch.
- C++ 单元测试框架对比:https://en.wikipedia.org/wiki/List_of_unit_testing_frameworks#C++
- CPP Unit Testing Framework
- Use a fuzzer to test handling of untrusted input (afl, libFuzzer, honggfuzz).
Check
- Build and run your tests with sanitizers enabled.
-
CPP Cpplint in Action Cpplint 是一个 Python 编写的基于 Google 代码规范的检测工具。它只是一个代码风格检测工具,其并不对代码逻辑、语法错误等进行检查。More: https://en.wikipedia.org/wiki/Cpplint
- Use static analysis (clang-tidy, cppcheck, coverity, PVS-Studio).
Clang 项目也提供了其他一些工具,包括代码的静态检查工具 Clang-Tidy 。这是一个比较全面的工具,它除了会提示你危险的用法,也会告诉你如何去现代化你的代码。默认情况下,Clang-Tidy 只做基本的分析。你也可以告诉它你想现代化你的代码和提高代码的可读性:
clang-tidy --checks='clang-analyzer-*,modernize-*,readability-*' test.cpp
-
Clang-Tidy 还是一个比较“重”的工具。它需要有一定的配置,需要能看到文件用到的头文件,运行的时间也会较长。而 Cppcheck 就是一个非常轻量的工具了。它运行速度飞快,看不到头文件、不需要配置就能使用。它跟 Clang-Tidy 的重点也不太一样:它强调的是发现代码可能出问题的地方,而不太着重代码风格问题,两者功能并不完全重叠。有条件的情况下,这两个工具可以一起使用。
-
Valgrind 算是一个老牌工具了。它是一个非侵入式的排错工具。根据 Valgrind 的文档,它会导致可执行文件的速度减慢 20 至 30 倍。但它可以在不改变可执行文件的情况下,只要求你在编译时增加产生调试信息的命令行参数(
-g),即可查出内存相关的错误。
int main()
{
  char* ptr = new char[20];
}
在 Linux 上使用 g++ -g test.cpp 编译之后,然后使用 valgrind --leak-check=full ./a.out 检查运行结果,得到的输出会如下所示:
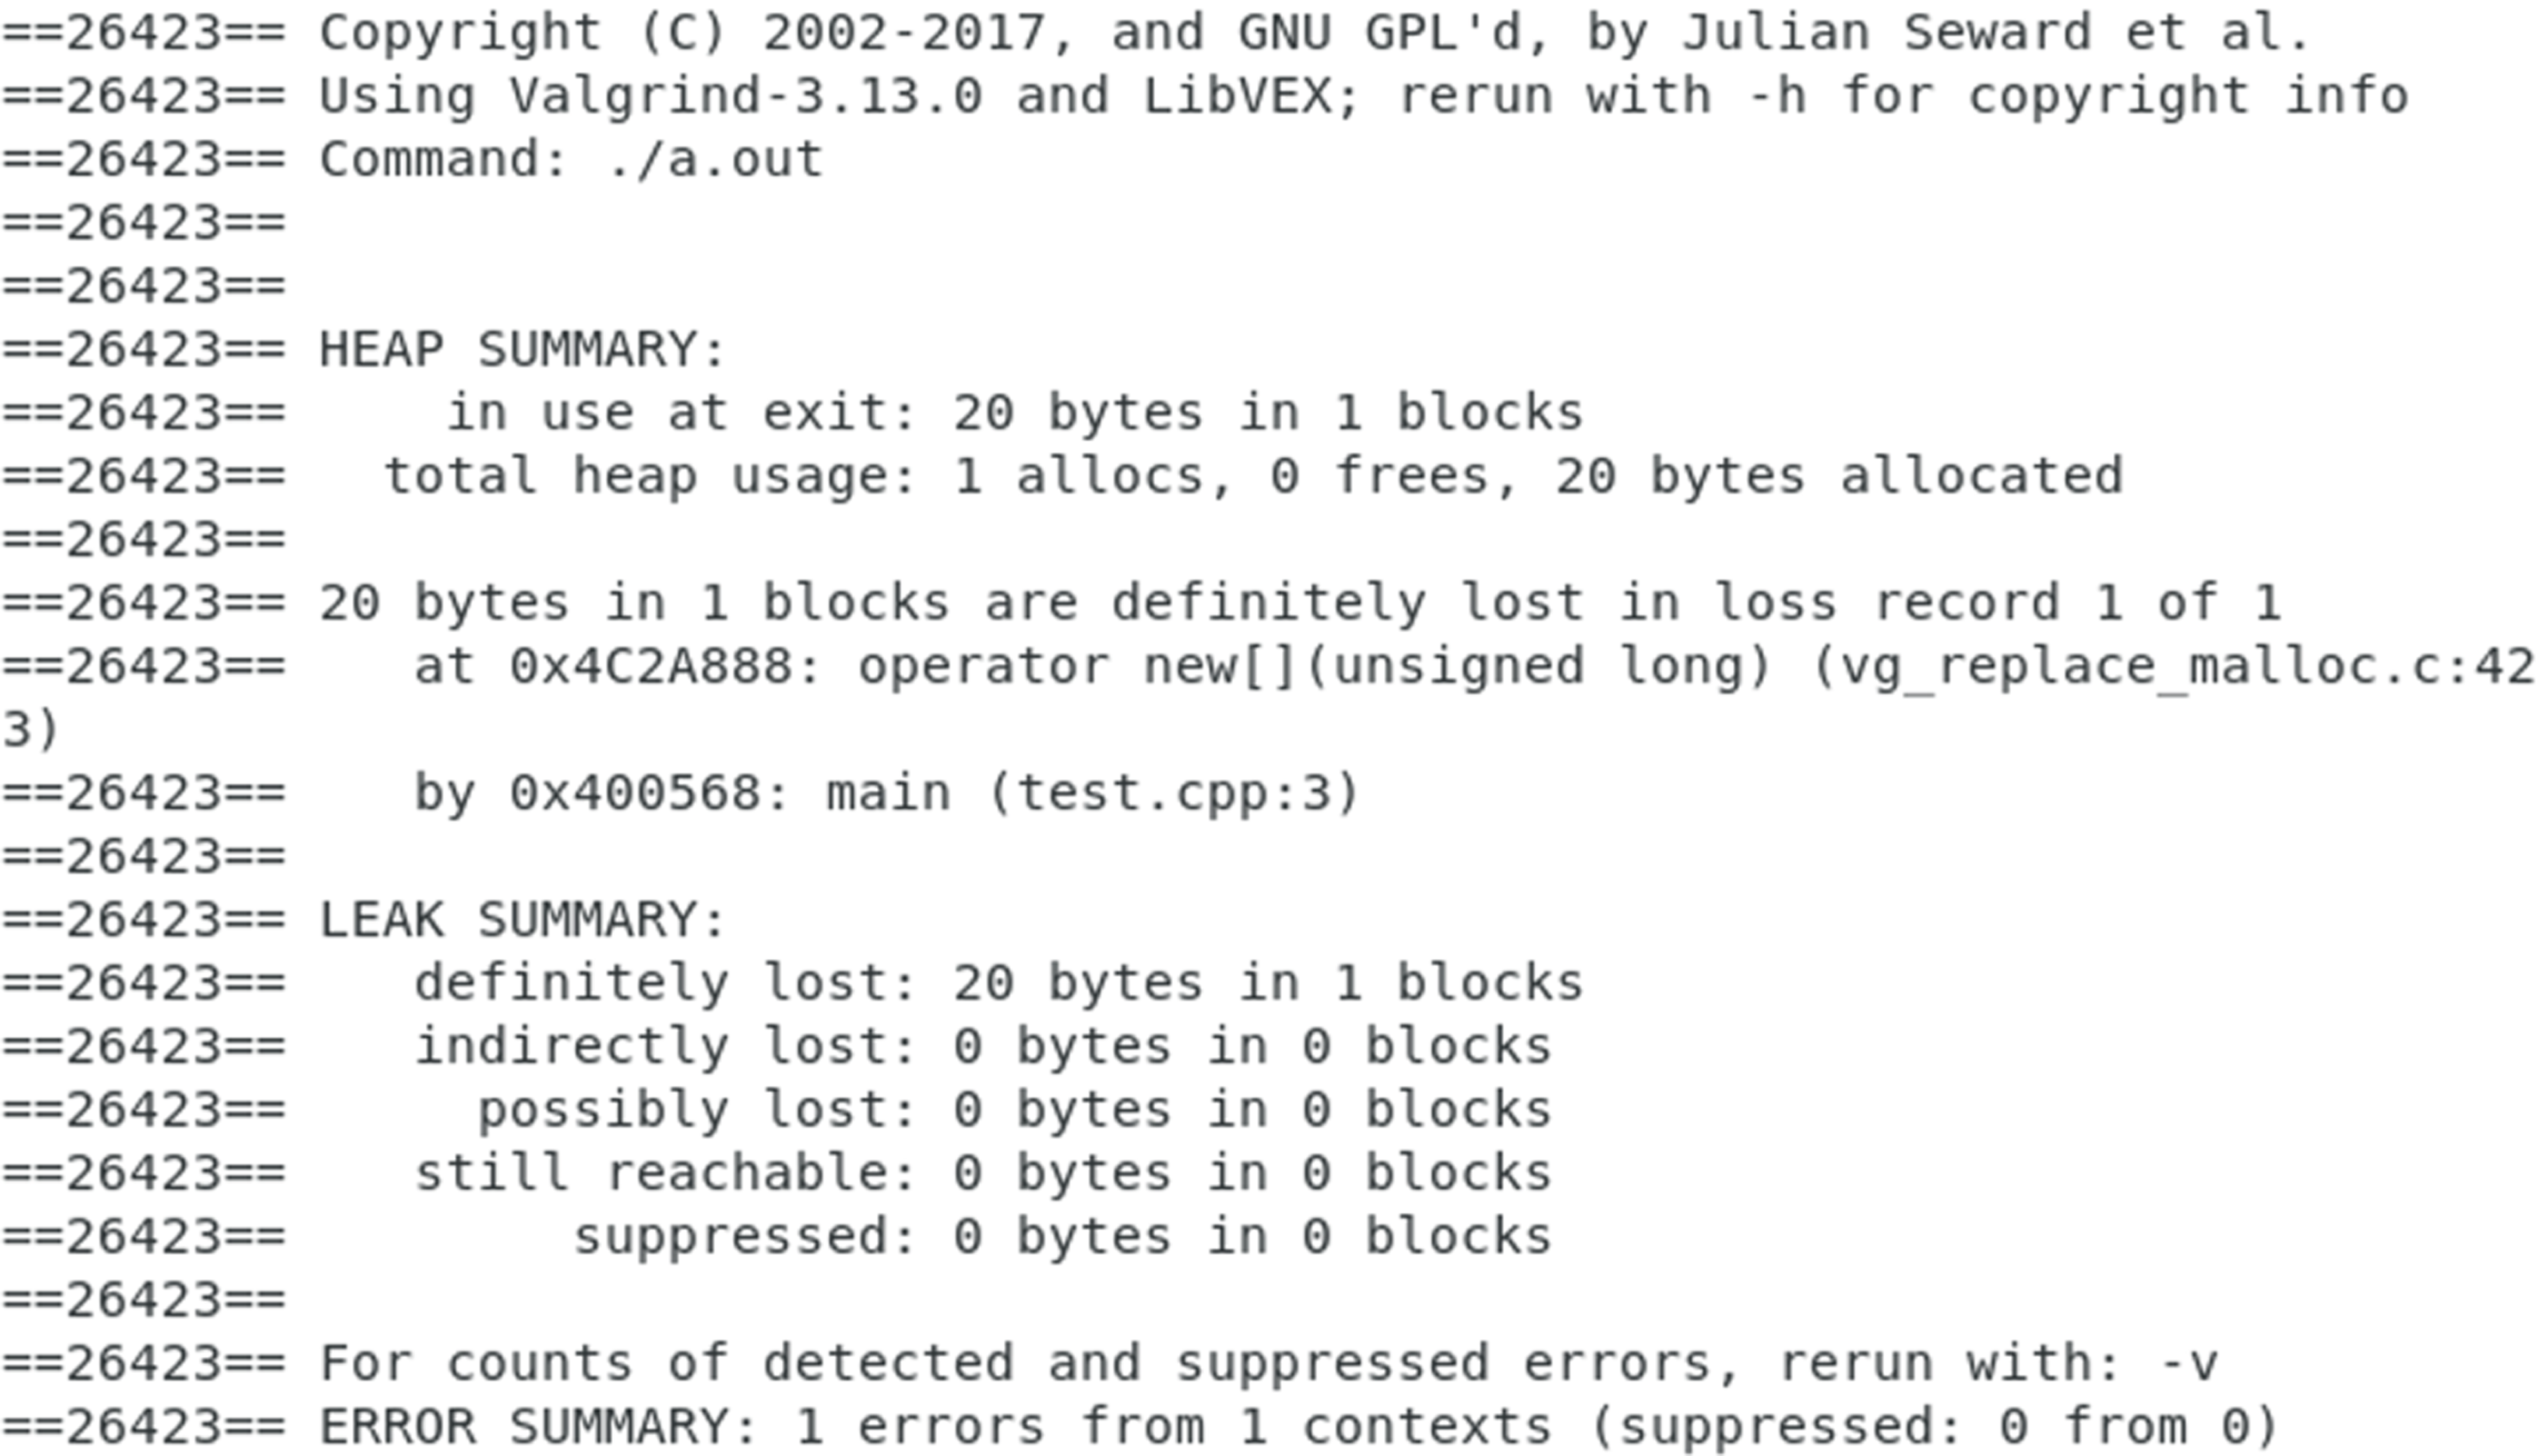
即其中包含了内存泄漏的信息,包括内存是从什么地方泄漏的。Valgrind 的功能并不只是内存查错,也包含了多线程问题分析等其他功能。要进一步了解相关信息,请查阅其文档。
- 在 nvwa 项目里,我也包含了一个很小的内存泄漏检查工具。它的最大优点是小巧,并且对程序运行性能影响极小;缺点主要是不及 Valgrind 易用和强大,只能检查 new 导致的内存泄漏,并需要侵入式地对项目做修改。
c++ test.cpp \../nvwa/nvwa/debug_new.cpp
- clangd-tidy, A Faster Alternative to clang-tidy
Why is clang-tidy in clangd so much faster than (run-)clang-tidy itself?
- facebook/infer A static analyzer for Java, C, C++, and Objective-C
Debug
- Build your tests with STL in debug mode:
_GLIBCXX_DEBUG
Undefined by default. When defined, compiles user code using the debug mode. When defined, _GLIBCXX_ASSERTIONS is defined automatically, so all the assertions enabled by that macro are also enabled in debug mode.
Tools
- 模版实例化工具:https://cppinsights.io/
- 编译运行工具:https://wandbox.org/
- 代码统计工具 (Count Lines of Code):https://github.com/AlDanial/cloc
Manual
Posts
- CPP in Action
- CPP Effective
- CPP Optimzing
- CPP Template in Action
- CPP Memory Order
- Bjarne Stroustrup’s C++ Style and Technique FAQ (Reading)
- CPP Lab
- Inside the C++ Object Model (深度探索 C++对象模型)
- CPP Reflection in Action
Common Libraries
glibc
源码:https://elixir.bootlin.com/glibc
GCC (the GNU Compiler Collection)
The GNU Compiler Collection includes front ends for C, C++, Objective-C, Fortran, Ada, Go, D, Modula-2, and COBOL as well as libraries for these languages (libstdc++,…). GCC was originally written as the compiler for the GNU operating system. The GNU system was developed to be 100% free software, free in the sense that it respects the user’s freedom.
We strive to provide regular, high quality releases, which we want to work well on a variety of native and cross targets (including GNU/Linux), and encourage everyone to contribute changes or help testing GCC. Our sources are readily and freely available via Git and weekly snapshots.
Major decisions about GCC are made by the steering committee, guided by the mission statement.
GCC Releases
GCC releases may be downloaded from our mirror sites.
Important: these are source releases, so will be of little use if you do not already have a C++ compiler installed. As one option, there are pre-compiled binaries. for various platforms.
You can also retrieve our sources using Git.
LLVM
https://github.com/llvm/llvm-project
Clang
Clang: a C language family frontend for LLVM
The Clang project provides a language front-end and tooling infrastructure for languages in the C language family (C, C++, Objective C/C++, OpenCL, and CUDA) for the LLVM project. Both a GCC-compatible compiler driver (clang) and an MSVC-compatible compiler driver (clang-cl.exe) are provided. You can get and build the source today.
Clang - Features and Goals
These features are:
- End-User Features:
- Utility and Applications:
- Internal Design and Implementation:
Why?
Development of the new front-end was started out of a need for a compiler that allows better diagnostics, better integration with IDEs, a license that is compatible with commercial products, and a nimble compiler that is easy to develop and maintain. All of these were motivations for starting work on a new front-end that could meet these needs.
Current Status
Clang is considered to be a production quality C, Objective-C, C++ and Objective-C++ compiler when targeting any target supported by LLVM. As example, Clang is used in production to build performance-critical software like Chrome or Firefox.
If you are looking for source analysis or source-to-source transformation tools, Clang is probably a great solution for you. Please see the C++ status page or the C status page for more information about what standard modes and features are supported.
C++ Support in Clang
目前 Clang11 可以支持 C++17 标准,更高版本的 Clang 可支持 C++20/C++23 部分特性,可见:https://clang.llvm.org/cxx_status.html
C Support in Clang
可见:https://clang.llvm.org/c_status.html
Get it and get involved
Start by getting the code, building it, and playing with it. This will show you the sorts of things we can do today and will let you have the “Clang experience” first hand: hopefully it will “resonate” with you.
Once you’ve done that, please consider getting involved in the Clang community. The Clang developers include numerous volunteer contributors with a variety of backgrounds. If you’re interested in following the development of Clang, signing up for a mailing list is a good way to learn about how the project works.
Refer
- https://rigtorp.se/cpp-best-practices/
- https://lefticus.gitbooks.io/cpp-best-practices/content/
- O’Reilly video: Learning C++ Best Practices